

A Look At Himax Technologies (HIMX) Valuation After Recent Share Price Swings
Recent performance puts Himax Technologies (HIMX) back on investors’ radar
Himax Technologies (HIMX) has seen mixed share performance recently, with a 10.1% decline over the past month but a 7.2% gain over the past 3 months. This has prompted closer attention from investors.
See our latest analysis for Himax Technologies.
At a share price of US$7.72, Himax’s recent 1-month share price return of a 10.1% decline and 7.2% gain over 3 months suggest momentum has cooled in the short term. Meanwhile, the 1-year total shareholder return of a 26.23% decline contrasts with an 11.35% gain over three years, hinting at shifting sentiment around growth prospects and risk.
If Himax’s recent swings have you thinking about where else capital could work, it might be worth scanning 34 AI infrastructure stocks for other potential semiconductor and AI hardware beneficiaries.
With Himax trading at US$7.72, recent returns, a value score of 3, and a price target only around 11% higher, the key question is simple: is there real upside left here, or is future growth already priced in?
Most Popular Narrative: 9.6% Undervalued
Himax’s fair value in the most widely followed narrative sits around US$8.54 per share, a touch above the recent US$7.72 close. This naturally raises questions about what is built into that gap.
The company's deepening engagement and design wins in emerging smart glasses/AR markets, underpinned by unique proprietary technologies in ultra-low power sensing (WiseEye), microdisplay, and nano-optics, create opportunities to capitalize on the rising demand for next-generation wearables, providing a new long-term revenue stream that will positively impact both top-line growth and margins.
Curious how a relatively modest upside case still leans on ambitious earnings, margin expansion and a lower future P/E than many peers enjoy? The narrative ties together auto displays, AR glasses and silicon photonics into one revenue and profit story. The exact mix and timing of those drivers is where things get interesting.
Result: Fair Value of $8.54 (UNDERVALUED)
Have a read of the narrative in full and understand what's behind the forecasts.
However, there are still clear pressure points, including demand volatility across key display segments and rising operating costs that could squeeze margins if revenue growth stalls.
Find out about the key risks to this Himax Technologies narrative.
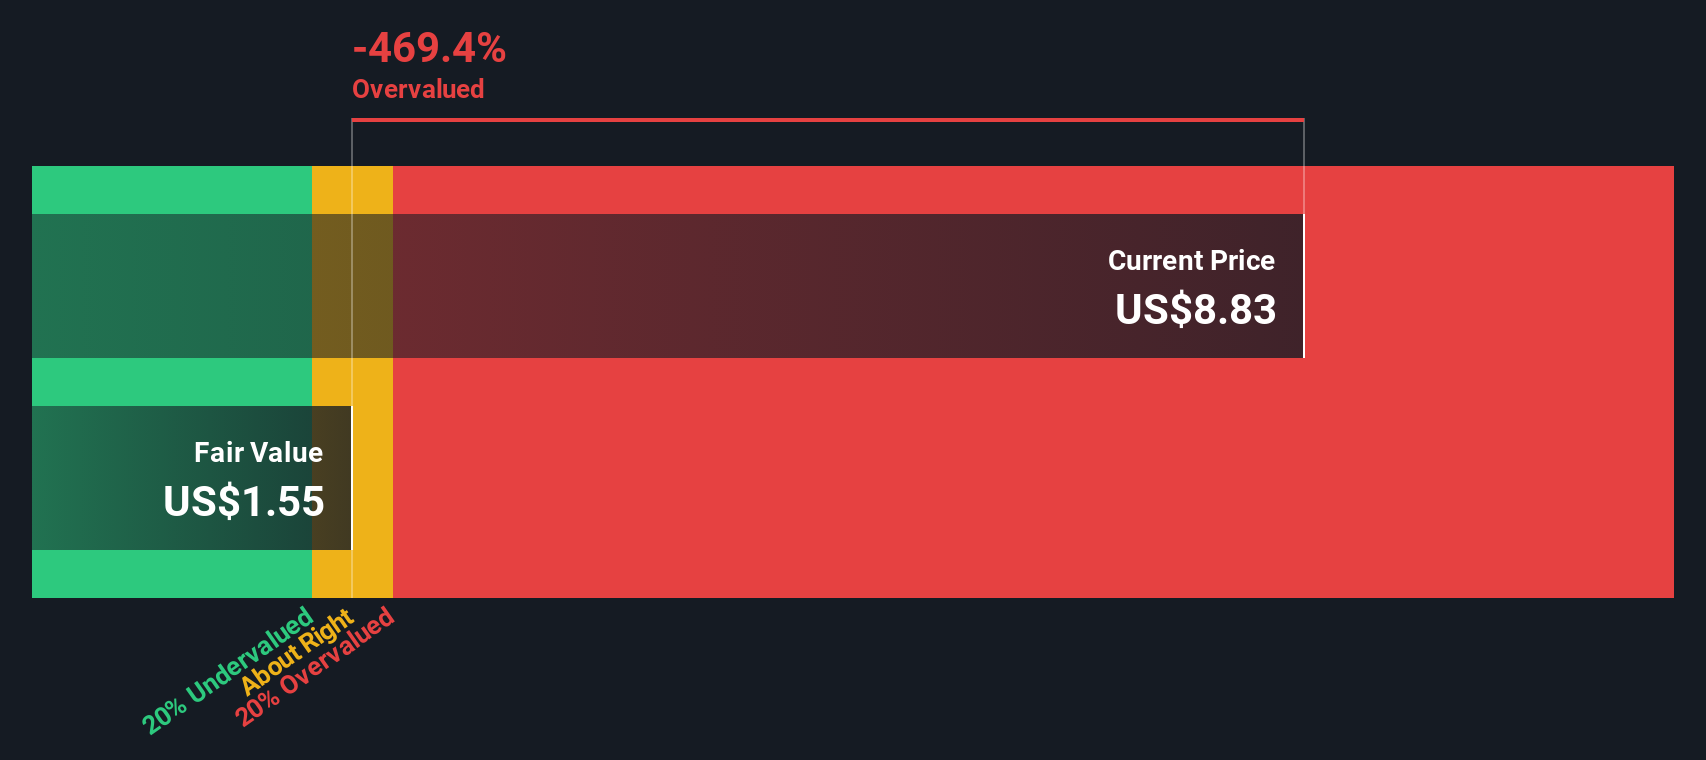
Another View: DCF Sends a Different Signal
The popular narrative suggests Himax is around 9.6% undervalued at a fair value of about US$8.54 per share. Our SWS DCF model, however, points the other way, with an estimated future cash flow value of US$2.28, implying Himax trades well above that level. So which story do you trust more: earnings power or cash flows?
Look into how the SWS DCF model arrives at its fair value.
Simply Wall St performs a discounted cash flow (DCF) on every stock in the world every day (check out Himax Technologies for example). We show the entire calculation in full. You can track the result in your watchlist or portfolio and be alerted when this changes, or use our stock screener to discover 54 high quality undervalued stocks. If you save a screener we even alert you when new companies match - so you never miss a potential opportunity.
Next Steps
With mixed signals on value, risk and growth, the real question is what you think. Take a moment to review the full picture, including 3 key rewards and 2 important warning signs.
Looking for more investment ideas?
If Himax has sharpened your focus, do not stop here. You will miss plenty of opportunities if you only watch a single stock or theme.
- Target potential mispricings by scanning our list of 54 high quality undervalued stocks that pair solid fundamentals with market skepticism.
- Prioritize resilience by reviewing 83 resilient stocks with low risk scores, highlighting companies that our model scores with relatively lower risk profiles.
- Spot earlier stage opportunities by checking our screener containing 24 high quality undiscovered gems, where fewer investors are currently paying attention.
This article by Simply Wall St is general in nature. We provide commentary based on historical data and analyst forecasts only using an unbiased methodology and our articles are not intended to be financial advice. It does not constitute a recommendation to buy or sell any stock, and does not take account of your objectives, or your financial situation. We aim to bring you long-term focused analysis driven by fundamental data. Note that our analysis may not factor in the latest price-sensitive company announcements or qualitative material. Simply Wall St has no position in any stocks mentioned.
Have feedback on this article? Concerned about the content? Get in touch with us directly. Alternatively, email editorial-team@simplywallst.com