

Is It Time To Reassess GameStop (GME) After Its Recent Price Swings?
- If you are wondering whether GameStop's current share price reflects its true value, you are not alone. This article will focus on what the numbers say about the stock rather than the hype around it.
- Recently, the share price closed at US$23.57, with an 11.7% gain over 30 days, a 14.3% return year to date, a 5.0% decline over 7 days and an 11.6% decline over the past year. The 3-year and 5-year returns sit at 15.4% and 112.1% respectively.
- These moves have kept GameStop in the spotlight, as traders and longer term holders react differently to shorter term swings and multi year returns. Even without a single headline event driving the price, the stock continues to attract attention as investors reassess what they are willing to pay for the business.
- Simply Wall St currently gives GameStop a valuation score of 2 out of 6. We will look at how various valuation methods treat the stock, and then finish by pointing you to a more complete way to think about what the market price really implies.
GameStop scores just 2/6 on our valuation checks. See what other red flags we found in the full valuation breakdown.
Approach 1: GameStop Discounted Cash Flow (DCF) Analysis
A Discounted Cash Flow, or DCF, model estimates what a business could be worth by projecting its future cash flows and then discounting those projections back to today using a required rate of return.
For GameStop, the model used is a 2 Stage Free Cash Flow to Equity approach. The latest twelve month free cash flow sits at about $563.2 million. Simply Wall St then projects free cash flow out to 2035, using analyst inputs where available and extending those patterns further into the future. By 2035, the projected free cash flow is $4,527.97 million (about $4.5b), with each year discounted back to a present value figure.
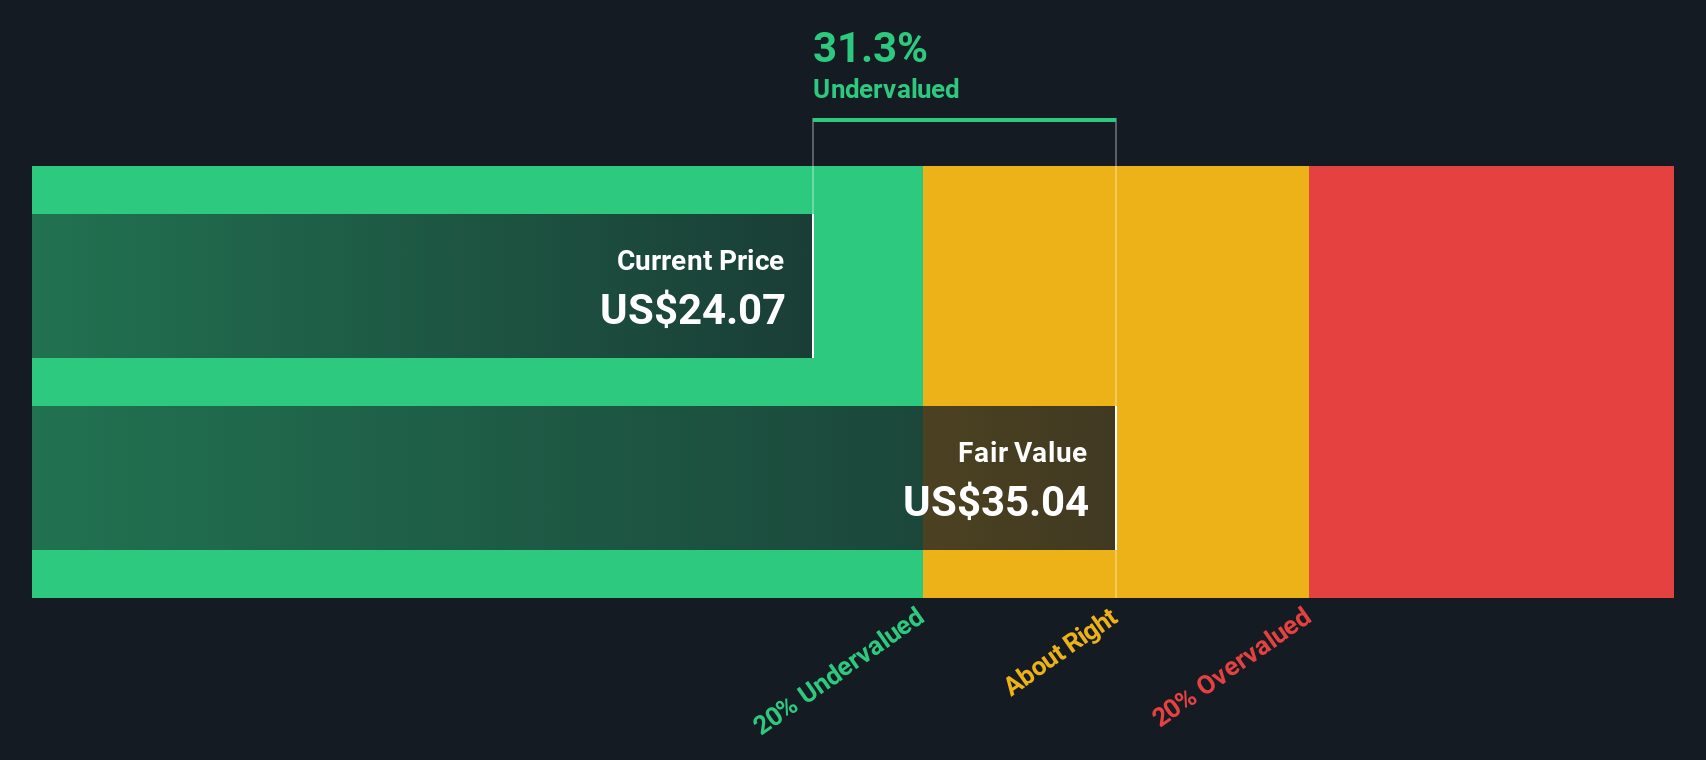
When all these discounted cash flows are added together, the model arrives at an estimated intrinsic value of US$110.19 per share. Compared with the recent share price of US$23.57, this implies the stock is 78.6% undervalued based on this DCF framework.
Result: UNDERVALUED
Our Discounted Cash Flow (DCF) analysis suggests GameStop is undervalued by 78.6%. Track this in your watchlist or portfolio, or discover 55 more high quality undervalued stocks.
Approach 2: GameStop Price vs Earnings
For companies that are generating earnings, the P/E ratio is a common way to gauge how much investors are currently paying for each dollar of profit. It gives you a quick sense of how the market is pricing the business relative to its earnings power.
What counts as a fair P/E usually reflects two things: how quickly investors think earnings could change over time, and how much risk they see in those earnings. Higher expected growth or lower perceived risk can support a higher P/E, while lower growth expectations or higher risk often point to a lower multiple.
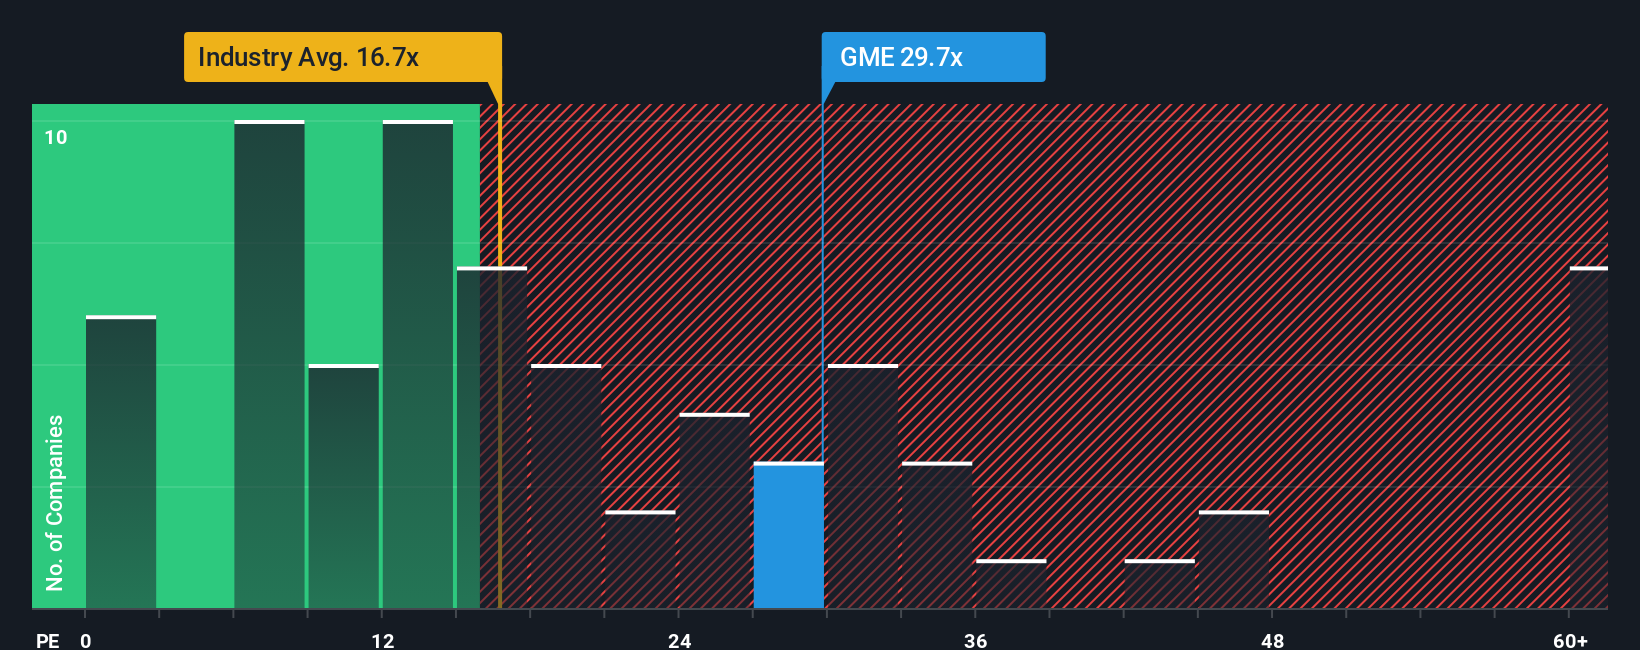
GameStop is currently trading on a P/E of 25.0x. That sits above the Specialty Retail industry average of about 21.4x and also above the peer group average of roughly 19.1x. Simply Wall St also calculates a proprietary Fair Ratio for GameStop, which is the P/E you might expect given factors like its earnings profile, industry, profit margins, market value and specific risks. Because this Fair Ratio is tailored to the company, it can be a more targeted benchmark than broad industry or peer averages. In this case, the Fair Ratio is not available, so it is not possible to classify the shares as overvalued, undervalued, or about right using this framework.
Result: ABOUT RIGHT
P/E ratios tell one story, but what if the real opportunity lies elsewhere? Start investing in legacies, not executives. Discover our 23 top founder-led companies.
Upgrade Your Decision Making: Choose your GameStop Narrative
Earlier we mentioned that there is an even better way to understand valuation, and that is where Narratives come in as a simple way for you to attach a clear story to your numbers, including what you think GameStop’s fair value should be and how its revenue, earnings and margins might develop over time.
A Narrative on Simply Wall St links three pieces together in one place: your view of the business, a financial forecast that reflects that view, and the fair value that follows from those assumptions.
You can access Narratives on the Community page, where millions of investors share their own versions. You can then compare each Narrative’s fair value with the current share price to help decide whether the stock looks attractive, fully priced, or expensive according to that story.
Because Narratives update automatically when new information such as earnings reports or news is entered, they can stay aligned with what is actually happening rather than being a one off calculation.
For example, one GameStop Narrative currently sets a fair value around US$220 per share while another sits closer to US$11.91, showing how different investors can look at the same company, plug in very different expectations, and end up with very different conclusions.
For GameStop, we will make it really easy for you with previews of two leading GameStop Narratives:
One leans firmly toward the upside case, and the other is far more cautious. Looking at both side by side can help you decide which assumptions feel closer to your own view of the company.
Fair value in this Narrative: US$220.00 per share
Implied undervaluation vs last close: about 89%
Revenue growth assumption: 31.15%
- Focuses on GameStop as a profitable, cash rich business, pointing to reported net profits, a large cash position and no long term debt as key strengths.
- Highlights Bitcoin holdings, a large base of directly registered shares and high retail investor engagement as support for the equity story.
- Ties a US$220 fair value to a very ambitious long term outcome including significant profitability, potential index inclusion and successful use of the cash and digital asset position.
Fair value in this Narrative: US$11.91 per share
Implied overvaluation vs last close: about 50%
Revenue growth assumption: 0%
- Starts from the challenges to GameStop’s traditional retail model, with pressure from digital game distribution, online competitors and a softer gaming market.
- Credits cost cutting and new initiatives like the Zip Buy Now, Pay Later partnership, but questions how much these changes alter the long term earnings profile.
- Emphasizes the influence of meme stock trading, cryptocurrency plans and speculation, arguing that the share price can move in ways that are not closely tied to underlying business performance.
Both Narratives use the same company and share price, but they tell very different stories about what those numbers could mean over time. If you want to see how other investors are framing the trade off between upside potential and the risks around GameStop, it is worth reading the full bull and bear cases alongside your own assumptions.
Curious how numbers become stories that shape markets? Explore Community Narratives
Do you think there's more to the story for GameStop? Head over to our Community to see what others are saying!

This article by Simply Wall St is general in nature. We provide commentary based on historical data and analyst forecasts only using an unbiased methodology and our articles are not intended to be financial advice. It does not constitute a recommendation to buy or sell any stock, and does not take account of your objectives, or your financial situation. We aim to bring you long-term focused analysis driven by fundamental data. Note that our analysis may not factor in the latest price-sensitive company announcements or qualitative material. Simply Wall St has no position in any stocks mentioned.
Have feedback on this article? Concerned about the content? Get in touch with us directly. Alternatively, email editorial-team@simplywallst.com