

Is Credit Acceptance (CACC) Pricing Reflect Recent Share Pullback Or Future Earnings Potential
- If you are wondering whether Credit Acceptance's current share price lines up with its underlying worth, this breakdown is designed to help you frame that question clearly and calmly.
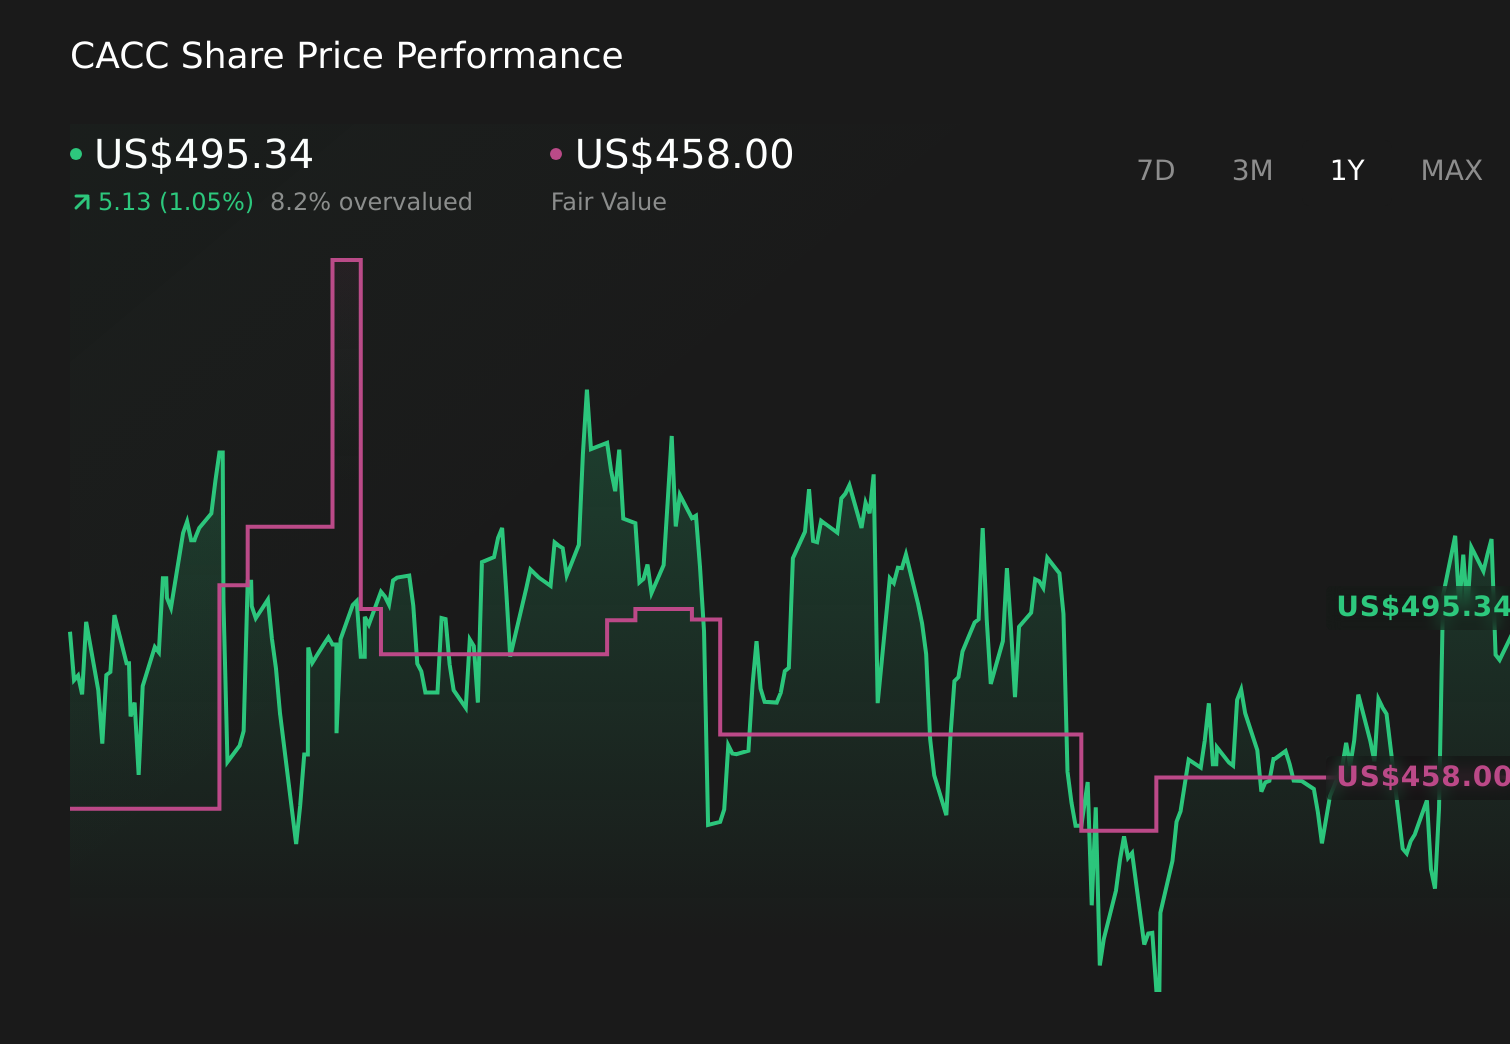
- The stock closed at US$483.98, with returns of 3.4% over 3 years and 33.9% over 5 years. The last 12 months show a 7% decline and shorter term moves of 3.9% decline over 7 days and 2.5% gain over 30 days, which can shift how investors think about both opportunity and risk.
- Recent coverage has focused on Credit Acceptance as a specialist in auto finance and the way its business model responds when credit conditions or consumer demand change. Headlines like these often influence sentiment around future loan growth, funding costs, and credit quality, which can feed into shorter term share price swings.
- Right now, Credit Acceptance scores 2 out of 6 on our valuation checks. We will walk through what different methods such as discounted cash flow, multiples, and peer comparisons suggest about the stock, then finish with a more holistic way to think about valuation that brings those pieces together.
Credit Acceptance scores just 2/6 on our valuation checks. See what other red flags we found in the full valuation breakdown.
Approach 1: Credit Acceptance Excess Returns Analysis
The Excess Returns model looks at how much value a company can create over and above the return that equity investors require. Instead of centering on cash flows, it compares what shareholders put in with what they are expected to earn on that equity over time.
For Credit Acceptance, the model uses a Book Value of US$142.66 per share and a Stable Book Value of US$136.25 per share, both based on median figures from the past 5 years. On that equity base, Stable EPS is US$26.37 per share, sourced from the median return on equity over the same period. The Average Return on Equity is 19.36%, while the Cost of Equity is US$14.14 per share. That gap produces an Excess Return of US$12.23 per share, which is what this model treats as value created beyond investors’ required return.
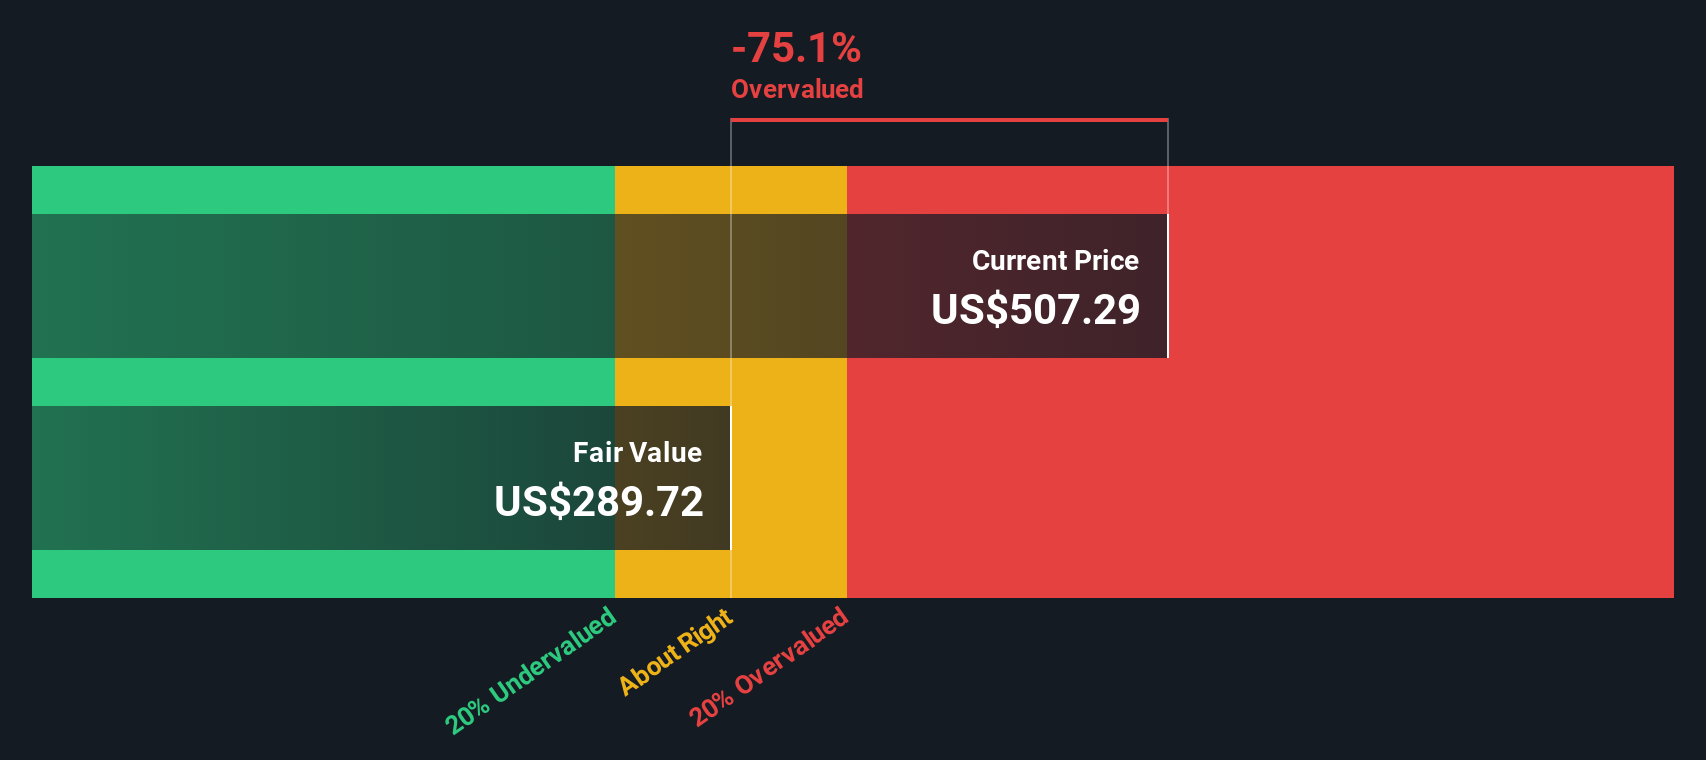
Running these inputs through the Excess Returns framework gives an intrinsic value estimate of about US$311.83 per share. Compared with the recent share price of US$483.98, this suggests the stock is 55.2% overvalued on this measure.
Result: OVERVALUED
Our Excess Returns analysis suggests Credit Acceptance may be overvalued by 55.2%. Discover 55 high quality undervalued stocks or create your own screener to find better value opportunities.
Approach 2: Credit Acceptance Price vs Earnings
For a profitable company like Credit Acceptance, the P/E ratio is a straightforward way to connect what you pay for each share with the earnings that back it. It lets you compare how the market is pricing those earnings relative to other options you could invest in.
What counts as a "normal" or "fair" P/E usually reflects what investors expect from a company’s future and how much risk they see. Higher growth or lower perceived risk can justify a higher multiple, while slower growth or higher risk can lead to a lower one.
Credit Acceptance currently trades on a P/E of 12.27x. That sits above the Consumer Finance industry average of 8.05x, but below the peer group average of 40.04x. Simply Wall St’s Fair Ratio for the stock is 16.56x, which is its estimate of a more tailored P/E level based on factors such as earnings growth, profit margins, industry, market cap and specific risks. This Fair Ratio can be more useful than a simple peer or industry comparison because it adjusts for the company’s own profile rather than assuming all firms should trade alike. With the actual P/E of 12.27x below the Fair Ratio of 16.56x, the shares screen as undervalued on this measure.
Result: UNDERVALUED

P/E ratios tell one story, but what if the real opportunity lies elsewhere? Start investing in legacies, not executives. Discover our 23 top founder-led companies.
Upgrade Your Decision Making: Choose your Credit Acceptance Narrative
Earlier we mentioned that there is an even better way to understand valuation. Narratives let you write your own story for Credit Acceptance by linking your view on its business drivers, forecast revenue, earnings and margins to a Fair Value that you can compare with the current share price. All of this is available inside Simply Wall St’s Community page, where different investors might, for example, see the recent US$458 Fair Value as either too low if they focus on technology upgrades and buybacks, or too high if they focus on loan performance and competition. Those Narratives then update automatically as new news or earnings are added so your fair value view stays aligned with the latest information.
Do you think there's more to the story for Credit Acceptance? Head over to our Community to see what others are saying!
This article by Simply Wall St is general in nature. We provide commentary based on historical data and analyst forecasts only using an unbiased methodology and our articles are not intended to be financial advice. It does not constitute a recommendation to buy or sell any stock, and does not take account of your objectives, or your financial situation. We aim to bring you long-term focused analysis driven by fundamental data. Note that our analysis may not factor in the latest price-sensitive company announcements or qualitative material. Simply Wall St has no position in any stocks mentioned.
Have feedback on this article? Concerned about the content? Get in touch with us directly. Alternatively, email editorial-team@simplywallst.com