

Is Old Dominion Freight Line (ODFL) Pricing In Too Much Future Growth?
- If you are wondering whether Old Dominion Freight Line is attractively priced today or if you would be paying up for quality, this article focuses squarely on what you are getting for the current share price.
- The stock last closed at US$193.21, with returns of 10.0% over 30 days, 21.4% year to date, and an 87.0% gain over 5 years, alongside a 7.0% decline over the past year and a 0.7% slip in the last week.
- Recent coverage of Old Dominion Freight Line has centered on its role in the US less than truckload sector and how investors weigh its operational strengths against the price they are paying for that exposure. This context helps explain why the stock can show strong multi year returns alongside shorter term pullbacks as expectations and sentiment adjust.
- Our valuation framework currently gives Old Dominion Freight Line a score of 1 out of 6. Next, we will walk through the standard valuation methods behind that figure, then finish with a broader way to think about what the market is really pricing in.
Old Dominion Freight Line scores just 1/6 on our valuation checks. See what other red flags we found in the full valuation breakdown.
Approach 1: Old Dominion Freight Line Discounted Cash Flow (DCF) Analysis
A Discounted Cash Flow, or DCF, model estimates what a company could be worth today by projecting its future cash flows and discounting them back to the present. It is essentially asking what future cash generation is worth in today’s dollars.
For Old Dominion Freight Line, the model used is a 2 Stage Free Cash Flow to Equity approach based on cash flow projections. The latest twelve month Free Cash Flow is about $757.2 million. Analysts provide explicit forecasts for the next few years, and Simply Wall St then extrapolates further, with projected Free Cash Flow in 2035 of about $1.4b, discounted back each year to reflect risk and the time value of money.
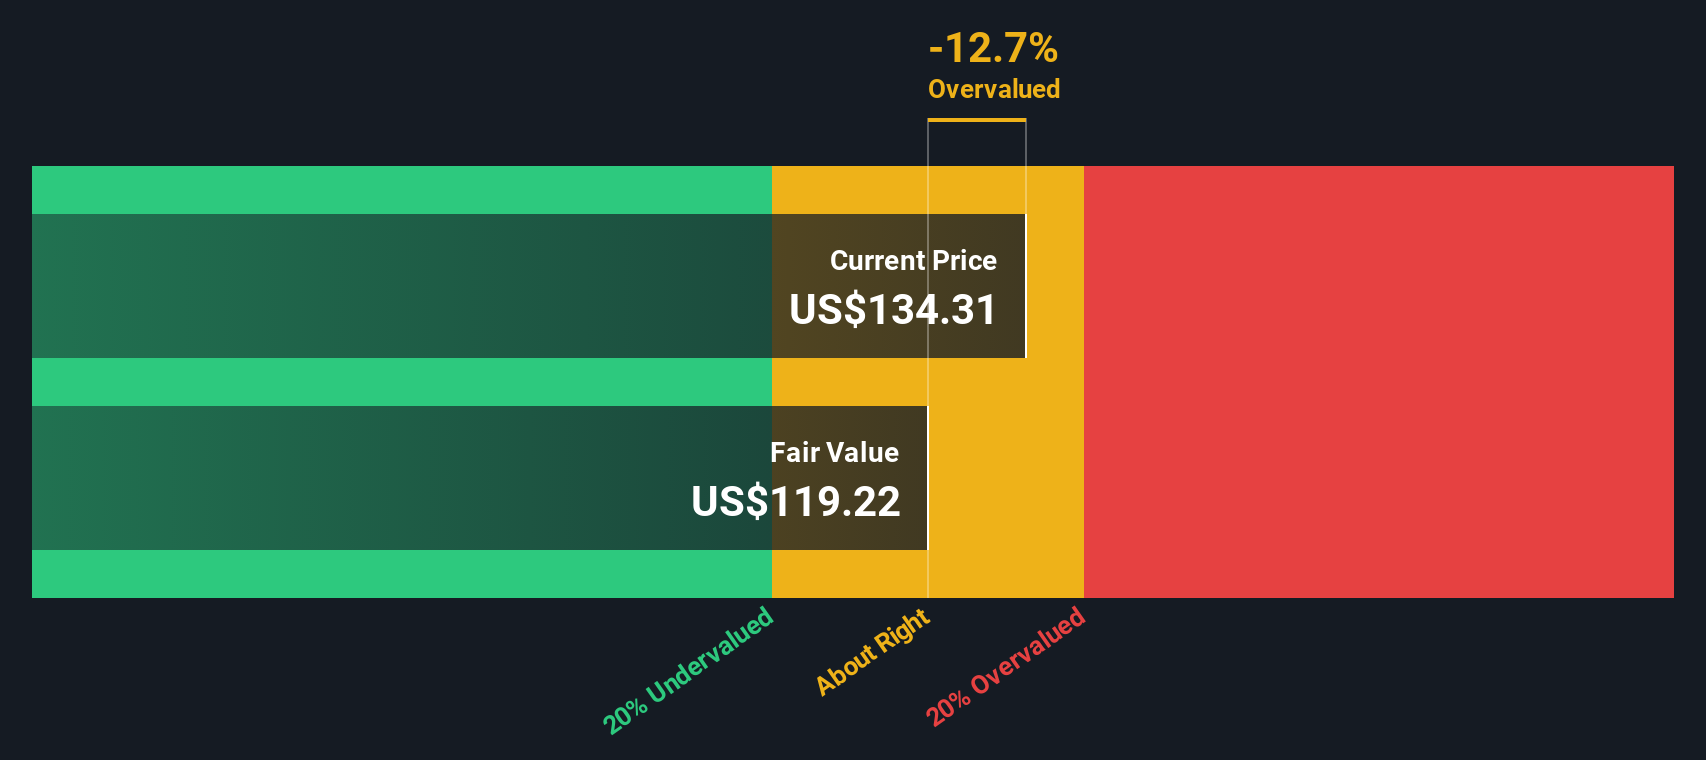
Putting those projections together, the DCF model arrives at an estimated intrinsic value of about $113.34 per share. Compared with the recent share price of $193.21, this implies the stock is around 70.5% overvalued based on these cash flow assumptions.
Result: OVERVALUED
Our Discounted Cash Flow (DCF) analysis suggests Old Dominion Freight Line may be overvalued by 70.5%. Discover 55 high quality undervalued stocks or create your own screener to find better value opportunities.
Approach 2: Old Dominion Freight Line Price vs Earnings
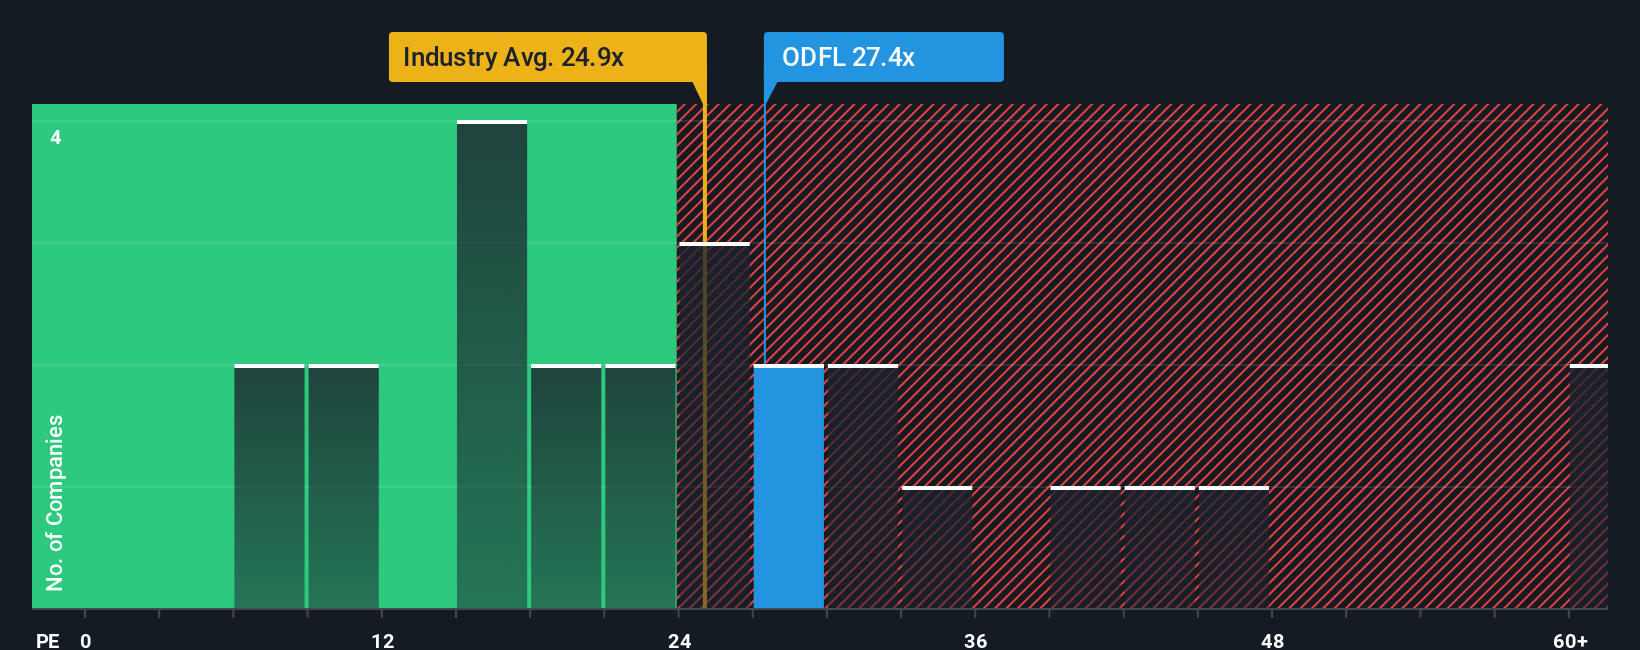
For a consistently profitable company, the P/E ratio is a straightforward way to think about what you are paying for each dollar of current earnings. It works well here because Old Dominion Freight Line generates earnings that can be compared to other listed transport businesses.
In general, higher growth expectations and lower perceived risk tend to justify a higher P/E, while slower growth or higher risk usually call for a lower, more conservative multiple. Today, Old Dominion Freight Line trades on a P/E of about 39.5x, versus an industry average of roughly 36.9x for Transportation companies and a peer group average of about 82.5x.
Simply Wall St’s Fair Ratio for Old Dominion Freight Line is about 20.2x. This is a proprietary estimate of what a reasonable P/E could be, given factors like the company’s earnings growth profile, margins, industry, market cap and risk characteristics. Because it is tailored to the company, this Fair Ratio can often be more informative than a simple comparison with peers or the broad industry.
Comparing the current 39.5x P/E with the 20.2x Fair Ratio suggests Old Dominion Freight Line is trading above what the model considers a fair earnings multiple.
Result: OVERVALUED
P/E ratios tell one story, but what if the real opportunity lies elsewhere? Start investing in legacies, not executives. Discover our 23 top founder-led companies.
Upgrade Your Decision Making: Choose your Old Dominion Freight Line Narrative
Earlier we mentioned that there is an even better way to understand valuation. On Simply Wall St you can use Narratives, where you set out your story for Old Dominion Freight Line, translate that story into assumptions for revenue, earnings, margins and a fair value, then compare that fair value with the current price. All of this is available within a simple tool on the Community page that updates as new news or earnings arrive. It lets you see, for example, how one investor might focus on a higher fair value of about US$232 with a future P/E near 37x, while another anchors on a more cautious view closer to US$123 with a future P/E around 25x. This gives you a clear sense of which story you agree with before deciding whether the current price looks high, low or about right.
For Old Dominion Freight Line, however, we'll make it really easy for you with previews of two leading Old Dominion Freight Line Narratives:
Each one lines up the same share price with a very different story about future earnings, margins and what a reasonable P/E could look like. Your job is simply to decide which version of the future feels closer to how you see the business.
🐂 Old Dominion Freight Line Bull Case
Fair value: US$232.00
Implied discount: around 17% below this narrative fair value
Assumed revenue growth: 8.53% a year
- Backs Old Dominion Freight Line to grow revenue and margins through continued investment in service centers, technology and efficiency, with capacity already in place to support higher volumes.
- Leans on strong cash generation, buybacks and dividends as signals of confidence, with analysts in this camp expecting earnings to reach about US$1.6b and EPS of US$7.72 by around April 2028.
- Requires comfort that the market will pay a higher P/E of 30.0x in 2028, above the current US Transportation industry P/E, and that softer recent freight trends will eventually improve rather than persist.
🐻 Old Dominion Freight Line Bear Case
Fair value: US$167.79
Implied premium: around 15% above this narrative fair value
Assumed revenue growth: 4.92% a year
- Assumes steadier, more moderate growth, with earnings forecast to reach about US$1.4b and EPS of US$7.08 by about September 2028, and some analysts expecting less than that.
- Accepts that Old Dominion Freight Line continues to invest and manage yields carefully, but sees the network as more mature and freight demand as uncertain, which could limit future return potential.
- Works off a future P/E of 28.3x that is still above the broader US Transportation industry, so it questions how much extra upside is left if freight softness, weaker volumes and higher overheads stick around longer than optimists expect.
Put simply, both narratives are using the same company facts, but one leans into stronger growth, higher margins and a richer future P/E, while the other builds in more tempered assumptions and a tighter margin for error at today’s price. If you want to see these stories with all the underlying numbers and let your own view sit somewhere between them, you can use the full range of community narratives for Old Dominion Freight Line to stress test your assumptions before making any decision.
Curious how numbers become stories that shape markets? Explore Community Narratives
Do you think there's more to the story for Old Dominion Freight Line? Head over to our Community to see what others are saying!

This article by Simply Wall St is general in nature. We provide commentary based on historical data and analyst forecasts only using an unbiased methodology and our articles are not intended to be financial advice. It does not constitute a recommendation to buy or sell any stock, and does not take account of your objectives, or your financial situation. We aim to bring you long-term focused analysis driven by fundamental data. Note that our analysis may not factor in the latest price-sensitive company announcements or qualitative material. Simply Wall St has no position in any stocks mentioned.
Have feedback on this article? Concerned about the content? Get in touch with us directly. Alternatively, email editorial-team@simplywallst.com