

Is AT&T (T) Still Attractively Priced After Its Strong Recent Share Price Rally
- If you are wondering whether AT&T's current share price still offers value, this article will walk through what the numbers are actually saying about the stock.
- AT&T's share price recently closed at US$28.68, with returns of 4.6% over the past week, 22.1% over the last month, 16.8% year to date and 14.8% over the past year. This performance has put the stock back on many investors' radars.
- Recent headlines around AT&T have focused on its large scale telecom footprint and continuing role as a major U.S. communications provider. These factors help frame how investors think about its stability and income potential. At the same time, discussions around sector competition and capital intensity continue to influence how the market weighs the risks attached to the current price.
- On Simply Wall St's valuation framework, AT&T scores a 5 out of 6, which means it screens as undervalued on most of the checks used. Next, we will look at how different valuation approaches arrive at that view, before finishing with a way to put those methods in a broader context.
Find out why AT&T's 14.8% return over the last year is lagging behind its peers.
Approach 1: AT&T Discounted Cash Flow (DCF) Analysis
A Discounted Cash Flow, or DCF, model takes projections of a company’s future cash flows and discounts them back to today, to estimate what the entire business could be worth right now.
For AT&T, the model used is a 2 Stage Free Cash Flow to Equity approach. The latest twelve month free cash flow is about $20.3b. Analyst inputs and Simply Wall St extrapolations then project free cash flow reaching about $21.7b by 2030, with a series of annual estimates across the next decade expressed in today’s money using a discount rate.
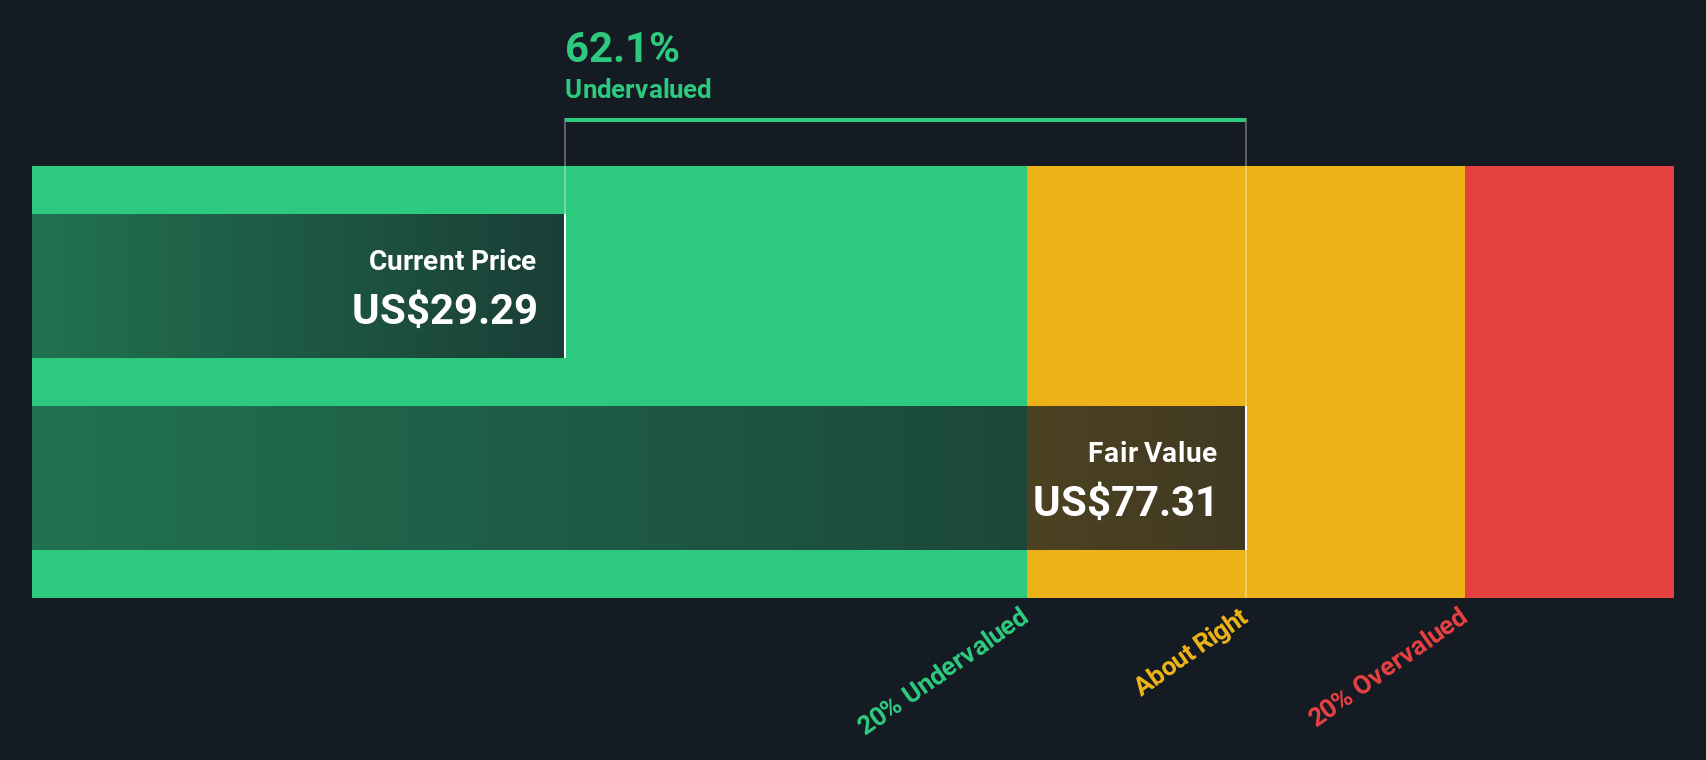
Adding up those discounted cash flows and an estimated value beyond the explicit forecast years gives an intrinsic value per share of $62.76. Compared with the recent share price of $28.68, the DCF output implies the shares trade at a 54.3% discount to this estimate. On this model, AT&T screens as undervalued.
Result: UNDERVALUED
Our Discounted Cash Flow (DCF) analysis suggests AT&T is undervalued by 54.3%. Track this in your watchlist or portfolio, or discover 55 more high quality undervalued stocks.
Approach 2: AT&T Price vs Earnings
For a profitable company like AT&T, the P/E ratio is a useful shorthand for what you are paying for each dollar of earnings. Higher growth expectations or lower perceived risk typically support a higher P/E, while slower growth or higher risk usually mean a lower P/E is seen as fair.
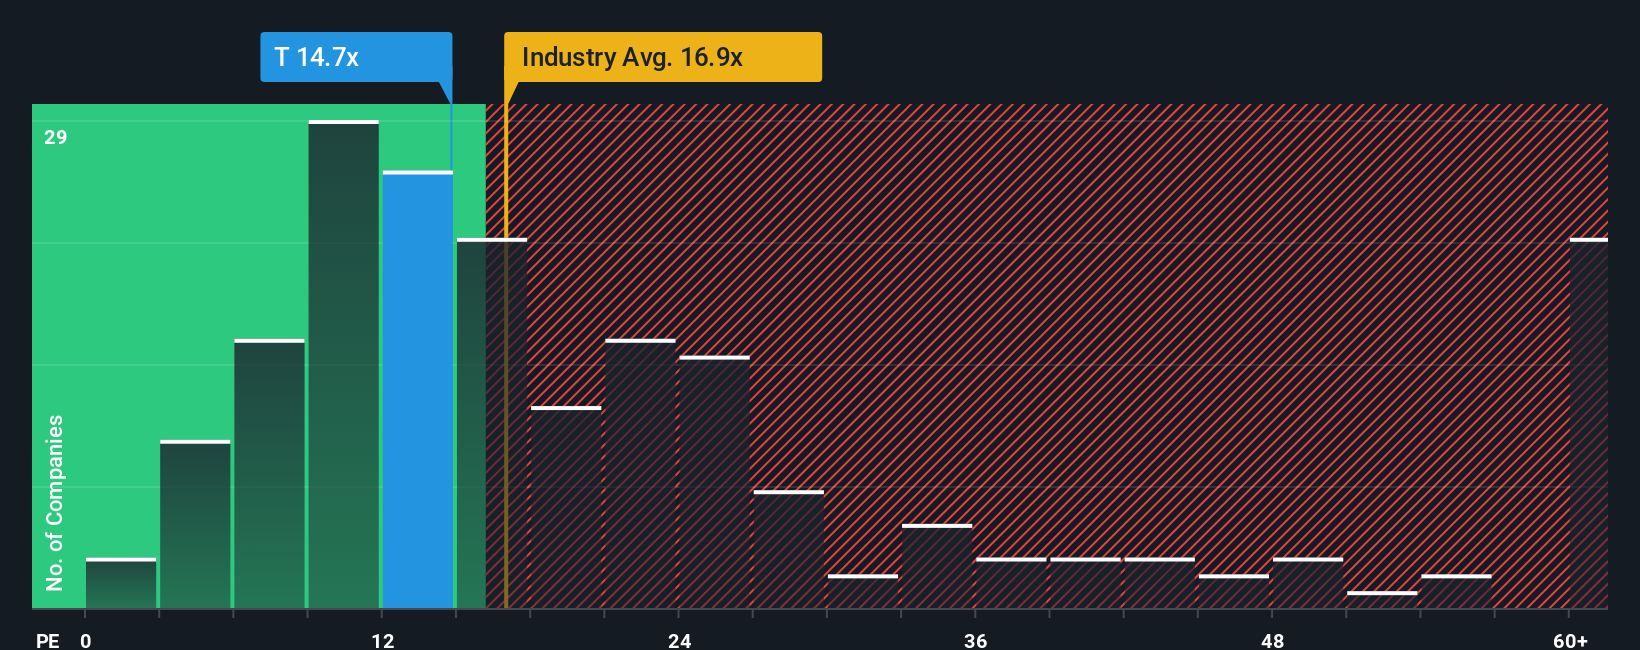
AT&T currently trades on a P/E of 9.17x. That sits below the Telecom industry average P/E of 16.50x and also below the peer group average of 11.38x. To go a step further, Simply Wall St estimates a “Fair Ratio” P/E for AT&T of 12.07x.
The Fair Ratio is a proprietary metric that reflects what P/E might make sense for AT&T given factors such as its earnings profile, industry, profit margins, market cap and specific risks. This tailored view is often more useful than a simple comparison with peers or the broad industry, because those benchmarks may differ on growth outlook, risk, or profitability.
Comparing AT&T’s current P/E of 9.17x with the Fair Ratio of 12.07x indicates that the shares are trading below that fitted multiple, which means the stock screens as undervalued on this approach.
Result: UNDERVALUED
P/E ratios tell one story, but what if the real opportunity lies elsewhere? Start investing in legacies, not executives. Discover our 23 top founder-led companies.
Upgrade Your Decision Making: Choose your AT&T Narrative
Earlier we mentioned that there is an even better way to understand valuation. Let us introduce you to Narratives, a simple tool on Simply Wall St's Community page that lets you attach a clear story about AT&T to a set of forecasts for revenue, earnings and margins. You can then link that story to a Fair Value you can compare with today’s price to help decide whether the stock looks attractive or expensive. The Narratives automatically update as new news or earnings arrive and different investors can express very different views. For example, one community member is currently using assumptions that lead to a Fair Value of about US$18.48, while another is using a Narrative that supports a Fair Value closer to US$33. This gives you a quick way to see where your own view of AT&T sits between the most cautious and most optimistic expectations.
For AT&T however we will make it really easy for you with previews of two leading AT&T Narratives:
Fair value in this narrative: US$32.12 per share
Implied discount to this fair value: 10.7% below the narrative fair value
Revenue growth assumption: 2%
- Sees AT&T as coming out of a shaky period, with debt still large but gradually being managed through cost savings, fiber investment and debt reduction.
- Emphasises bundled wireless and broadband offers, fiber roll out and ongoing cost cuts as key levers to support earnings and help sustain the dividend.
- Flags meaningful risks around high leverage, potential wage and infrastructure costs, regulatory shifts and new technologies such as satellite internet and 5G use cases.
Fair value in this narrative: US$18.48 per share
Implied premium to this fair value: 55.2% above the narrative fair value
Revenue growth assumption: 1.39%
- Comes from a long term shareholder who has lived through a weak share price, acquisitions and divestments that did not work out and a dividend cut.
- Questions whether the recent share price strength reflects company specific progress or just a strong market and whether AT&T can stand out in a competitive industry.
- Uses a personal price target around 15% above the current level to reassess confidence in management, the business fundamentals and the reliability of future dividends.
Together, these Narratives show how two investors can look at the same company and reach very different conclusions about value, growth and risk. They give you clear starting points for deciding where your own expectations for AT&T sit on that spectrum and whether the current price fits your approach.
Do you think there's more to the story for AT&T? Head over to our Community to see what others are saying!

This article by Simply Wall St is general in nature. We provide commentary based on historical data and analyst forecasts only using an unbiased methodology and our articles are not intended to be financial advice. It does not constitute a recommendation to buy or sell any stock, and does not take account of your objectives, or your financial situation. We aim to bring you long-term focused analysis driven by fundamental data. Note that our analysis may not factor in the latest price-sensitive company announcements or qualitative material. Simply Wall St has no position in any stocks mentioned.
Have feedback on this article? Concerned about the content? Get in touch with us directly. Alternatively, email editorial-team@simplywallst.com