

Is It Time To Reconsider Circle Internet Group (CRCL) After Its NYSE Listing And Price Swings
- If you are trying to work out whether Circle Internet Group is attractively priced or not, the key question is how its current share price lines up with the value of the business behind it.
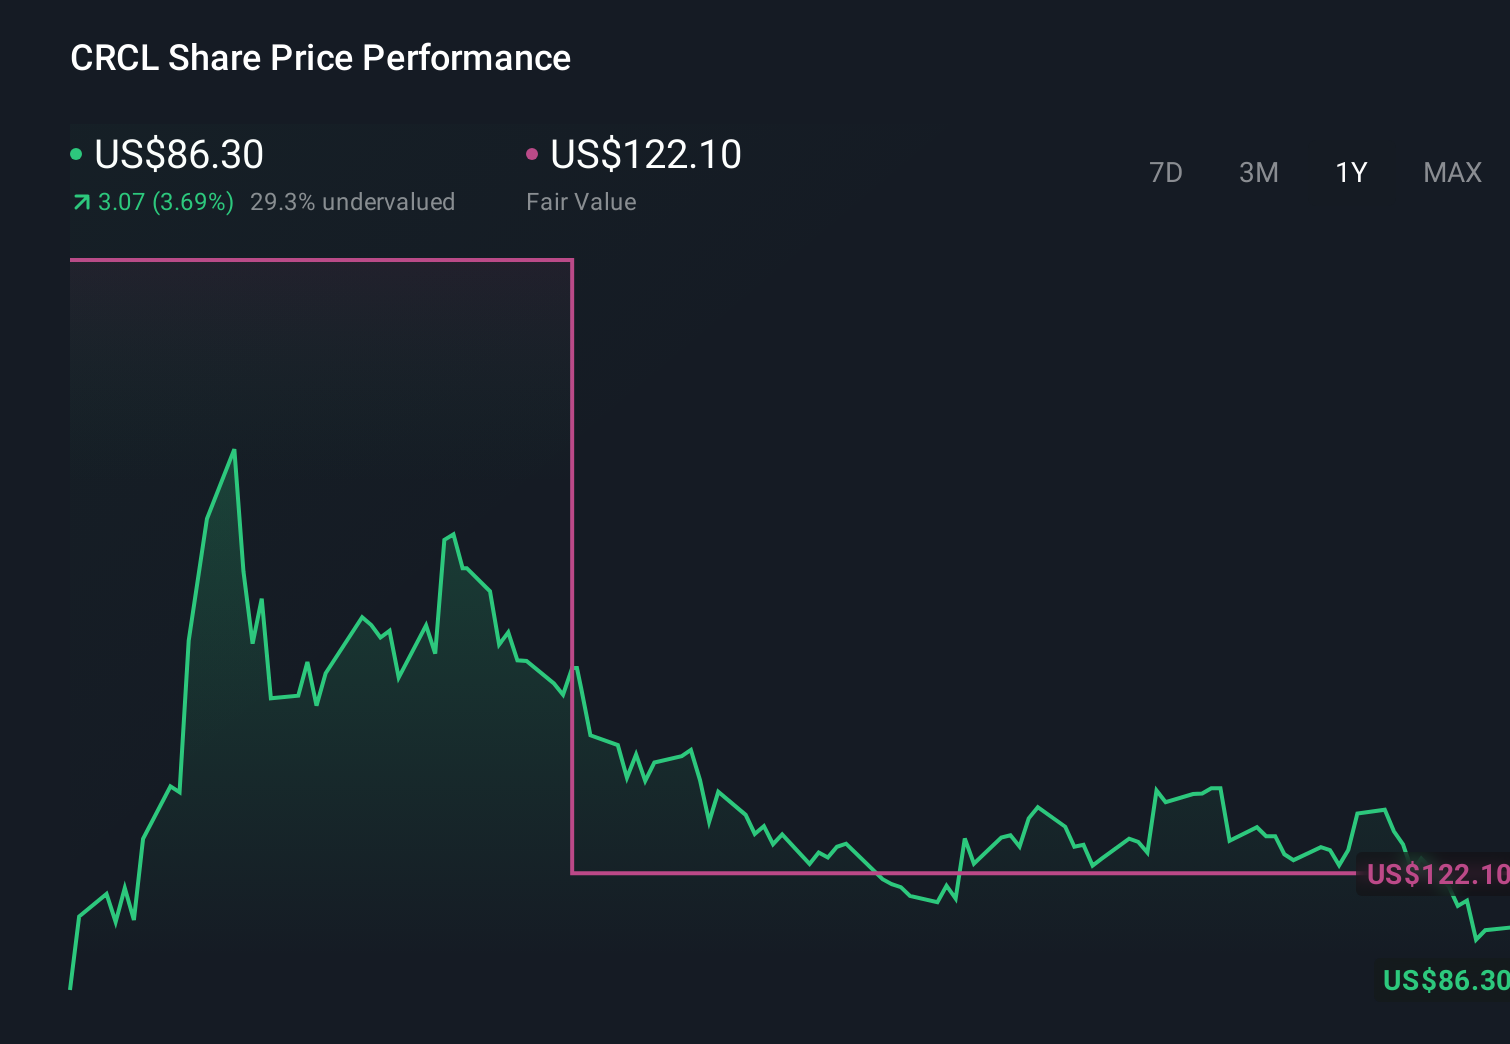
- The stock last closed at US$61.62, and recent returns have been mixed, with a 3.1% gain over the past week but declines of 21.6% over 30 days and 26.2% year to date.
- Recent coverage around Circle has focused on its position as a major player behind USD Coin and its listing on the NYSE under the ticker CRCL. This has brought the company onto more investors' radars and helps frame the recent share price moves as investors weigh up what public market pricing should look like for a business closely tied to digital dollar infrastructure.
- Right now, our valuation model suggests Circle Internet Group scores 1 out of 6 on our value checks. Next, we will walk through several valuation approaches to see what is driving that result, then finish with a broader way to think about value that goes beyond a single score.
Circle Internet Group scores just 1/6 on our valuation checks. See what other red flags we found in the full valuation breakdown.
Approach 1: Circle Internet Group Discounted Cash Flow (DCF) Analysis
A Discounted Cash Flow, or DCF, model takes estimates of the cash a company could generate in the future and discounts those amounts back to today to arrive at an estimate of what the business might be worth now.
For Circle Internet Group, the model used is a 2 Stage Free Cash Flow to Equity approach that works with cash flow projections. The latest twelve month free cash flow is about $329.2 million, and analysts provide detailed estimates out to 2030, with Simply Wall St extrapolating further to complete a 10 year view. For example, projected free cash flow for 2030 is $498.4 million, with intermediate years in the $289.5 million to $682.9 million range on the raw projections provided.
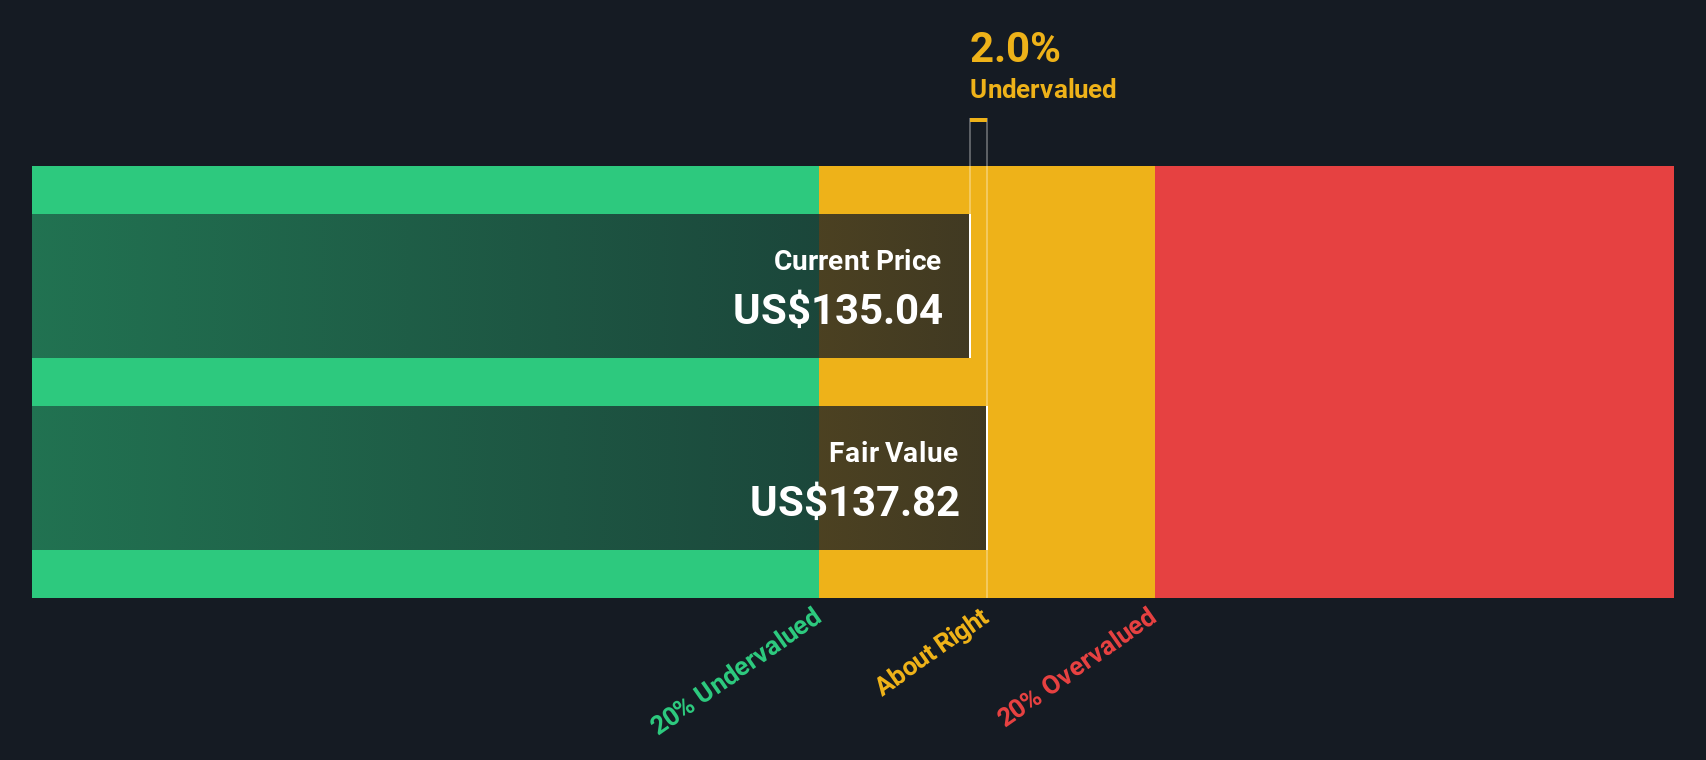
After discounting those projected cash flows back to today, the model suggests an estimated intrinsic value of about $39.93 per share, compared with the recent share price of $61.62. That gap implies the stock is around 54.3% overvalued based on this DCF view alone.
Result: OVERVALUED
Our Discounted Cash Flow (DCF) analysis suggests Circle Internet Group may be overvalued by 54.3%. Discover 54 high quality undervalued stocks or create your own screener to find better value opportunities.
Approach 2: Circle Internet Group Price vs Sales
For Circle Internet Group, the preferred yardstick is the price to sales, or P/S, ratio, which is often useful when earnings are limited or volatile but revenue is a more stable anchor for comparison across software companies.
In general, investors tend to accept a higher or lower P/S multiple depending on what they expect for future growth and how much risk they see in the business. Higher expected growth and lower perceived risk usually justify a higher “normal” P/S, while slower growth or higher risk point to a lower one.
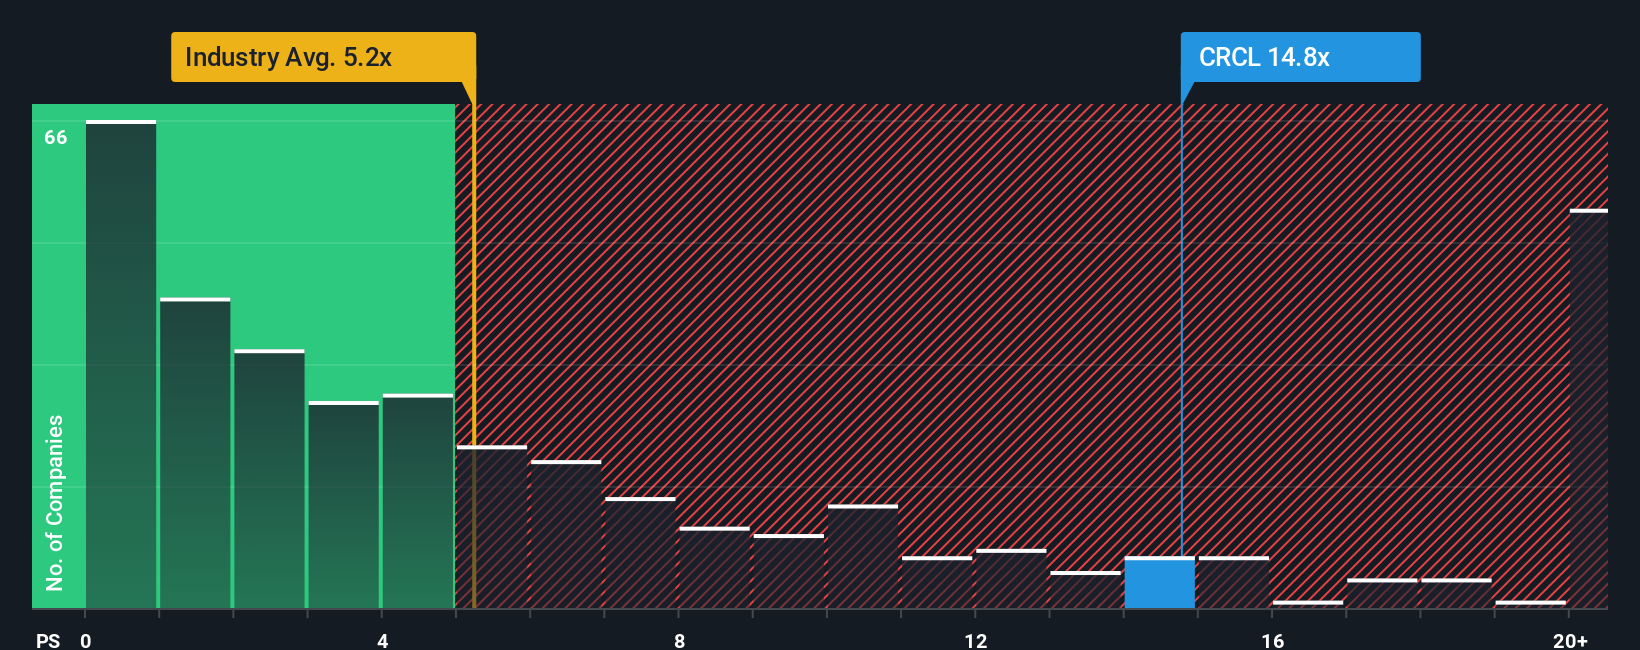
Circle currently trades on a P/S ratio of 6.02x. That sits below the peer average of 7.29x, but above the broader Software industry average of 3.64x. Simply Wall St’s Fair Ratio for Circle is 3.72x, which is its proprietary view of what a reasonable P/S multiple could be, after considering factors such as earnings growth, industry, profit margins, market cap and specific risks.
Compared with simple peer or industry comparisons, the Fair Ratio aims to be more tailored, because it adjusts for those company specific drivers rather than treating all software stocks the same. With Circle’s actual P/S of 6.02x sitting above the Fair Ratio of 3.72x, the shares screen as expensive on this metric.
Result: OVERVALUED
P/S ratios tell one story, but what if the real opportunity lies elsewhere? Start investing in legacies, not executives. Discover our 23 top founder-led companies.
Upgrade Your Decision Making: Choose your Circle Internet Group Narrative
Earlier we mentioned that there is an even better way to understand valuation. On Simply Wall St that means using Narratives, where you write a clear story about Circle Internet Group, link it to specific assumptions for future revenue, earnings and margins, then see the fair value that drops out and compare it with the current price.
On the Community page, Narratives are an accessible tool used by millions of investors to connect a company’s story to a numbers based forecast, and then to an implied fair value that updates automatically when new news, earnings or guidance is added to the platform.
For Circle, one Narrative might lean closer to the higher fair value of about US$270.91 with revenue growth assumptions of roughly 42.2% a year and a future P/E of 87.5x. Another might sit near US$60.00 with revenue growth assumptions of about 16.8% a year and a future P/E of 36.4x. Comparing each Narrative’s fair value to today’s share price can then help you decide whether you see the stock as priced richly, conservatively, or somewhere in between.
For Circle Internet Group, however, we will make it really easy for you with previews of two leading Circle Internet Group narratives:
🐂 Circle Internet Group Bull Case
Fair value: US$122.10 per share
Implied pricing gap: about 49.5% below this fair value based on the recent price of US$61.62
Assumed revenue growth: 19%
- Frames Circle as a key USDC issuer with a business model tied to interest income on fully backed reserves and broad real-world use cases for digital dollars.
- Highlights GENIUS Act regulation, global adoption, and partnerships such as Coinbase, Visa, and Stripe as important supports for the USDC ecosystem.
- Flags interest rate sensitivity, regulatory constraints, revenue sharing with Coinbase, and competition from Tether as important risks that could affect future economics.
🐻 Circle Internet Group Bear Case
Fair value: US$60.00 per share
Implied pricing gap: about 2.6% above this fair value based on the recent price of US$61.62
Assumed revenue growth: 16.8%
- Sets out a more cautious view that focuses on execution risk around new products and tokenization, along with possible regulatory constraints on rewards and capital.
- Points to dependence on reserve yields and the chance that expenses linked to platform expansion and distribution could weigh on earnings.
- Uses a lower fair value of US$60.00 as an anchor and encourages readers to test analyst-style assumptions for revenues, margins, and P/E against their own outlook before forming a view on the current price.
Do you think there's more to the story for Circle Internet Group? Head over to our Community to see what others are saying!
This article by Simply Wall St is general in nature. We provide commentary based on historical data and analyst forecasts only using an unbiased methodology and our articles are not intended to be financial advice. It does not constitute a recommendation to buy or sell any stock, and does not take account of your objectives, or your financial situation. We aim to bring you long-term focused analysis driven by fundamental data. Note that our analysis may not factor in the latest price-sensitive company announcements or qualitative material. Simply Wall St has no position in any stocks mentioned.
Have feedback on this article? Concerned about the content? Get in touch with us directly. Alternatively, email editorial-team@simplywallst.com