

Is Liberty Latin America (LILA) Pricing Reflect Its DCF And Price To Sales Signals Today
- If you are wondering whether Liberty Latin America is priced attractively right now, you are not alone. The stock's recent moves have raised fresh questions about what a fair value really looks like.
- The share price sits at US$7.73, with returns of 6.5% year to date, 7.2% over 1 year, 3.2% over 30 days and a 6.0% decline over the last week, alongside longer term declines of 12.5% over 3 years and 31.2% over 5 years.
- These mixed returns come as investors continue to reassess Liberty Latin America's position in the broader telecom sector and its long term prospects across the Latin American region. While there has not been a single headline event driving the moves, ongoing operational updates and regional telecom developments have kept sentiment shifting over time.
- On our checklist based framework, Liberty Latin America scores 5 out of 6 on valuation, as shown in our valuation score, which suggests several metrics flag the shares as potentially undervalued. Next we will look at how different valuation approaches, including cash flow and multiples, stack up for Liberty Latin America, then finish with a way to tie those numbers into a fuller view of value.
Find out why Liberty Latin America's 7.2% return over the last year is lagging behind its peers.
Approach 1: Liberty Latin America Discounted Cash Flow (DCF) Analysis
A Discounted Cash Flow model estimates what a company could be worth by projecting its future cash flows and discounting them back to today, so you can compare that value to the current share price.
For Liberty Latin America, the latest reported Free Cash Flow is about $197.3 million. Analysts provide explicit forecasts for the next few years, and Simply Wall St then extends those out using its own assumptions, giving projected Free Cash Flow of $707.5 million in 2030. All figures here are in $ and use a 2 Stage Free Cash Flow to Equity approach, which models one period of higher growth followed by a more mature phase.
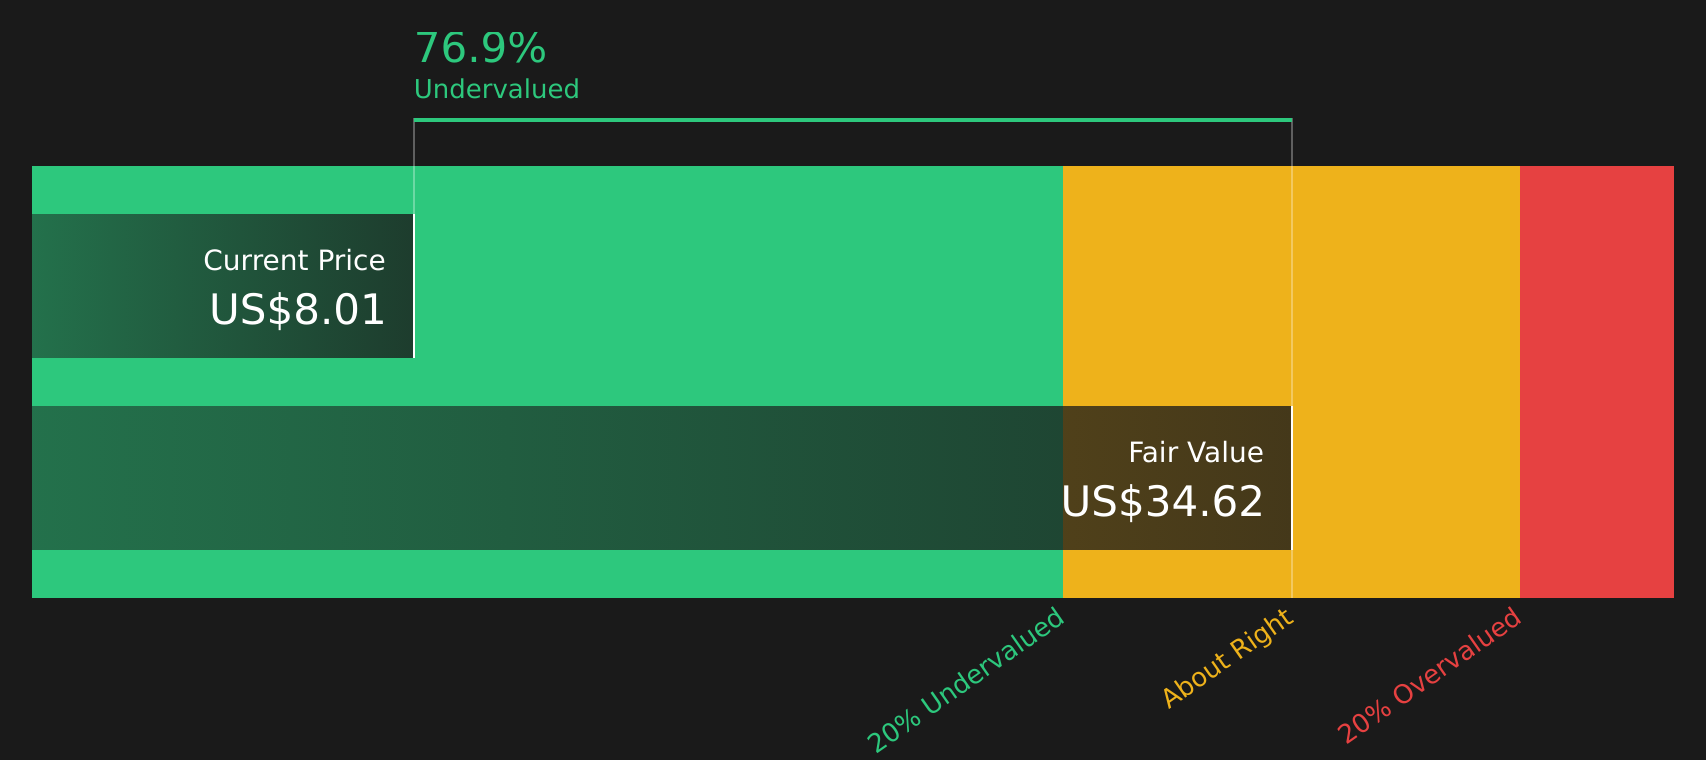
When all those projected cash flows are discounted back and summed, the model arrives at an estimated intrinsic value of about $34.58 per share. Compared with the recent share price of $7.73, this implies the stock is 77.6% undervalued based on this DCF framework.
Result: UNDERVALUED
Our Discounted Cash Flow (DCF) analysis suggests Liberty Latin America is undervalued by 77.6%. Track this in your watchlist or portfolio, or discover 53 more high quality undervalued stocks.
Approach 2: Liberty Latin America Price vs Sales
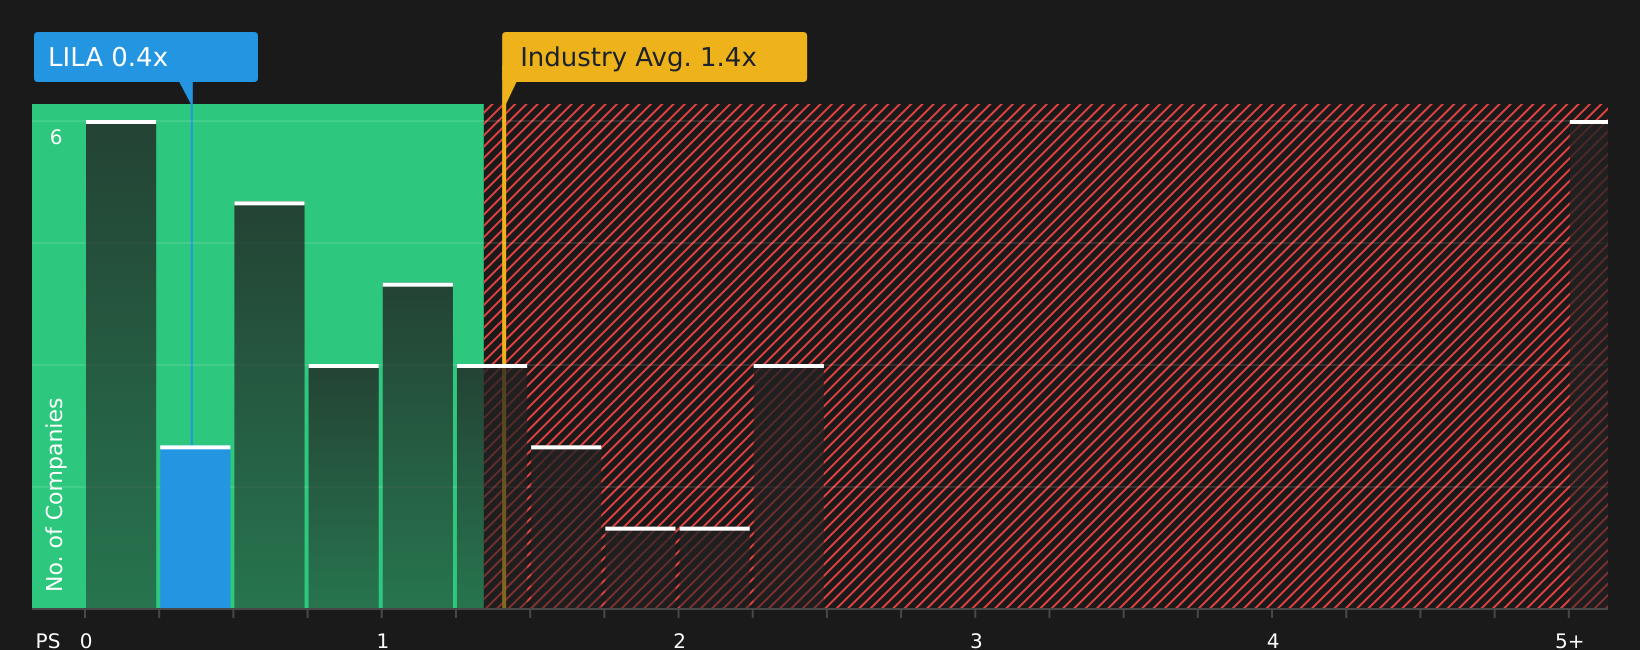
For companies where earnings can be uneven, the P/S multiple is often a useful cross check because it focuses on how much investors are paying for each dollar of revenue rather than profit. It is especially helpful for telecom businesses, where accounting items can make net income less straightforward.
What counts as a "normal" or "fair" P/S depends on factors like expected growth in revenue, business risk and how stable margins are. Higher growth and lower risk usually line up with a higher justified multiple, while slower growth or higher uncertainty tend to support a lower one.
Liberty Latin America currently trades on a P/S of 0.35x. That sits below the Telecom industry average of 1.27x and below the peer average of 1.95x. Simply Wall St's Fair Ratio for Liberty Latin America is 1.64x, which is its proprietary view of what the P/S should be after considering the company's earnings growth profile, industry, profit margins, market cap and risk factors. This Fair Ratio can be more informative than a simple comparison to peers or the broad industry, because it adjusts for Liberty Latin America's specific characteristics. With the current P/S of 0.35x versus a Fair Ratio of 1.64x, the shares screen as undervalued on this measure.
Result: UNDERVALUED
P/S ratios tell one story, but what if the real opportunity lies elsewhere? Start investing in legacies, not executives. Discover our 22 top founder-led companies.
Upgrade Your Decision Making: Choose your Liberty Latin America Narrative
Earlier we mentioned that there is an even better way to understand valuation, and that is where Narratives come in, giving you a simple story behind your own fair value, revenue, earnings and margin assumptions for Liberty Latin America, then linking that story to a forecast and a fair value you can compare with the current price on Simply Wall St's Community page, where Narratives are updated automatically when new news or earnings arrive. For example, one Liberty Latin America Narrative might lean toward the higher fair value of about US$14.90 with revenue reaching roughly US$5.0b and earnings of US$324.0 million by 2028, while another might lean toward the lower fair value of about US$6.00 with revenue closer to US$4.7b and earnings of US$249.2 million. By setting up or following Narratives like these, you can quickly see how your view compares with others and decide whether the current share price of US$7.73 looks above or below the fair value that fits your own story.
Do you think there's more to the story for Liberty Latin America? Head over to our Community to see what others are saying!

This article by Simply Wall St is general in nature. We provide commentary based on historical data and analyst forecasts only using an unbiased methodology and our articles are not intended to be financial advice. It does not constitute a recommendation to buy or sell any stock, and does not take account of your objectives, or your financial situation. We aim to bring you long-term focused analysis driven by fundamental data. Note that our analysis may not factor in the latest price-sensitive company announcements or qualitative material. Simply Wall St has no position in any stocks mentioned.
Have feedback on this article? Concerned about the content? Get in touch with us directly. Alternatively, email editorial-team@simplywallst.com