


- If you are wondering whether Ladder Capital's current share price lines up with its underlying worth, you are not alone. This article is designed to help you frame that question clearly.
- The stock last closed at US$10.44, with returns of 0.3% over the past week, a 5.9% decline over the past month, a 5.9% decline year to date, and total returns of a 2.7% decline over 1 year, 21.1% over 3 years, and 34.0% over 5 years.
- Recent coverage has focused on Ladder Capital as a US listed commercial real estate finance company, with investors paying close attention to how credit markets and property sector conditions affect mortgage REITs and related lenders. These themes help frame how the market reacts to shifts in funding costs, real estate trends, and broader sentiment toward income focused financials.
- Right now, Ladder Capital scores 0 out of 6 on Simply Wall St's valuation checks, giving it a 0/6 value score. Next we will walk through what different valuation methods say about that score and suggest a more complete way to think about value that we will come back to at the end.
Ladder Capital scores just 0/6 on our valuation checks. See what other red flags we found in the full valuation breakdown.
Approach 1: Ladder Capital Excess Returns Analysis
The Excess Returns model looks at whether a company is earning more on its equity than it costs to fund that equity. If the return on equity comfortably clears the cost of equity, the stock can justify trading above its book value. If it does not, the model tends to point to a lower intrinsic value.
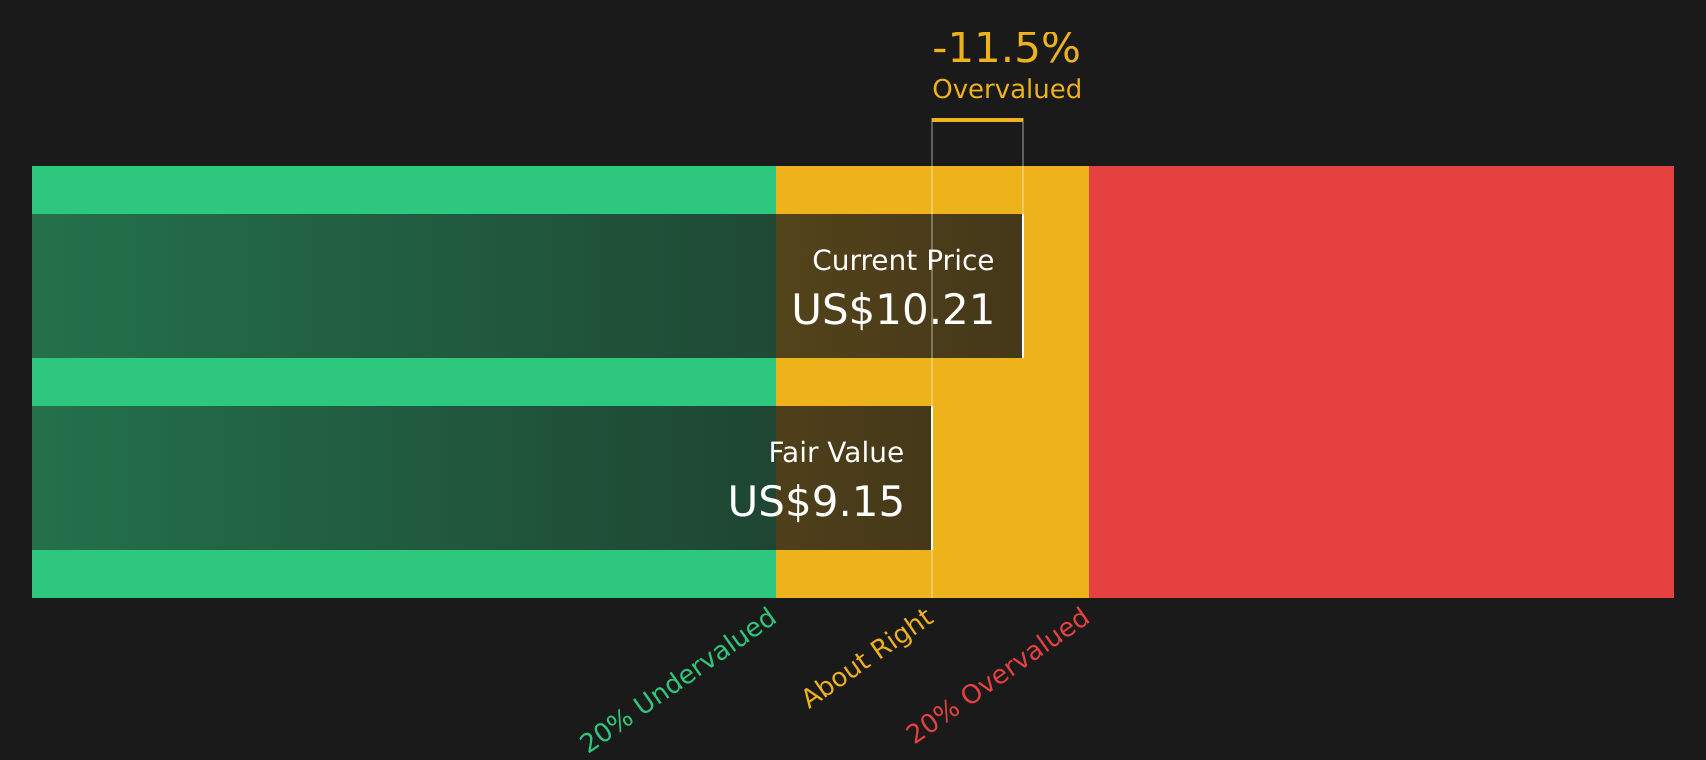
For Ladder Capital, the model uses a Book Value of US$11.66 per share and a Stable EPS of US$0.73 per share, based on the median return on equity from the past 5 years. The Average Return on Equity is 6.57%, compared with a Cost of Equity of US$0.80 per share. That setup produces an Excess Return of US$0.07 per share, which is modest, and a Stable Book Value of US$11.15 per share, based on weighted future book value estimates from 2 analysts.
Putting these inputs together, the Excess Returns model estimates an intrinsic value of about US$9.26 per share. Against the recent share price of US$10.44, this implies Ladder Capital trades at roughly a 12.8% premium, so the stock screens as overvalued on this framework.
Result: OVERVALUED
Our Excess Returns analysis suggests Ladder Capital may be overvalued by 12.8%. Discover 53 high quality undervalued stocks or create your own screener to find better value opportunities.
Approach 2: Ladder Capital Price vs Earnings
For profitable companies like Ladder Capital, the P/E ratio is a useful yardstick because it links what you pay directly to the earnings the business is currently generating. Investors usually accept a higher P/E when they expect stronger earnings growth or see lower risk in those earnings, and a lower P/E when they see more uncertainty or weaker growth potential.
Ladder Capital currently trades on a P/E of 20.70x. That is above the Mortgage REITs industry average P/E of 10.02x and also above a peer average of 16.57x, so on simple comparisons the stock looks more expensive than many of its sector peers.
Simply Wall St’s Fair Ratio for Ladder Capital is 13.68x. This is a proprietary P/E level that reflects factors such as the company’s earnings profile, its industry, profit margins, market cap and assessed risks, rather than just comparing it with a broad industry or a small peer group. Because it adjusts for those company specific inputs, the Fair Ratio aims to give a more tailored anchor than raw peer or industry multiples. With the current P/E of 20.70x sitting above the Fair Ratio of 13.68x, the stock screens as overvalued on this metric.
Result: OVERVALUED

P/E ratios tell one story, but what if the real opportunity lies elsewhere? Start investing in legacies, not executives. Discover our 21 top founder-led companies.
Upgrade Your Decision Making: Choose your Ladder Capital Narrative
Earlier we mentioned that there is an even better way to understand valuation, so let us introduce you to Narratives, a simple idea where you write a short story about Ladder Capital that connects your view on its business drivers to a set of numbers such as future revenue, earnings, margins and a fair value, then compare that fair value to today’s price to decide what action, if any, makes sense.
On Simply Wall St, Narratives live in the Community page and are used by millions of investors as an accessible tool, because instead of just accepting a single P/E or model output, you can pick or create the story that best matches your own expectations and instantly see the implied fair value and how it moves when new information like earnings or fresh news is added to the platform.
For Ladder Capital, one investor might focus on the upside case behind an analyst price target of US$14.00, while another anchors to the more cautious US$11.50 target. Narratives help you see how those different stories, with different revenue and earnings paths, lead to different fair values that you can continuously compare with the current share price.
Do you think there's more to the story for Ladder Capital? Head over to our Community to see what others are saying!

This article by Simply Wall St is general in nature. We provide commentary based on historical data and analyst forecasts only using an unbiased methodology and our articles are not intended to be financial advice. It does not constitute a recommendation to buy or sell any stock, and does not take account of your objectives, or your financial situation. We aim to bring you long-term focused analysis driven by fundamental data. Note that our analysis may not factor in the latest price-sensitive company announcements or qualitative material. Simply Wall St has no position in any stocks mentioned.
Have feedback on this article? Concerned about the content? Get in touch with us directly. Alternatively, email editorial-team@simplywallst.com