


- If you are wondering whether Otter Tail is fairly priced or offering hidden value, this article will walk through what the current share price might be telling you.
- The stock last closed at US$85.10, with returns of 0.2% over 7 days, a 1.7% decline over 30 days, 4.5% year to date, 9.6% over 1 year, 25.6% over 3 years and 124.9% over 5 years, which gives useful context before looking at any valuation work.
- Recent coverage around Otter Tail has focused on keeping investors informed through evergreen analysis rather than reacting to a single short term event. That context matters because it frames the current share price within a broader discussion of the business rather than one headline.
- On our framework the company records a valuation score of 2 out of 6. Next we will walk through what different valuation approaches say about Otter Tail, before finishing with a way to think about value that goes beyond the numbers alone.
Otter Tail scores just 2/6 on our valuation checks. See what other red flags we found in the full valuation breakdown.
Approach 1: Otter Tail Dividend Discount Model (DDM) Analysis
The Dividend Discount Model evaluates Otter Tail based solely on the dividends it is expected to pay, then discounts those future payments back into today’s dollars. It is most useful when dividends are relatively predictable and supported by current earnings.
For Otter Tail, the model uses a recent annual dividend per share of about US$2.43, a return on equity of 21.50% and a payout ratio of roughly 25.85%. That payout level suggests only around a quarter of earnings are being returned as dividends, with the rest retained in the business. The DDM growth rate used in the model is capped at 3.41%, even though the underlying expected growth input is 15.94%. This keeps the dividend growth assumption more conservative.
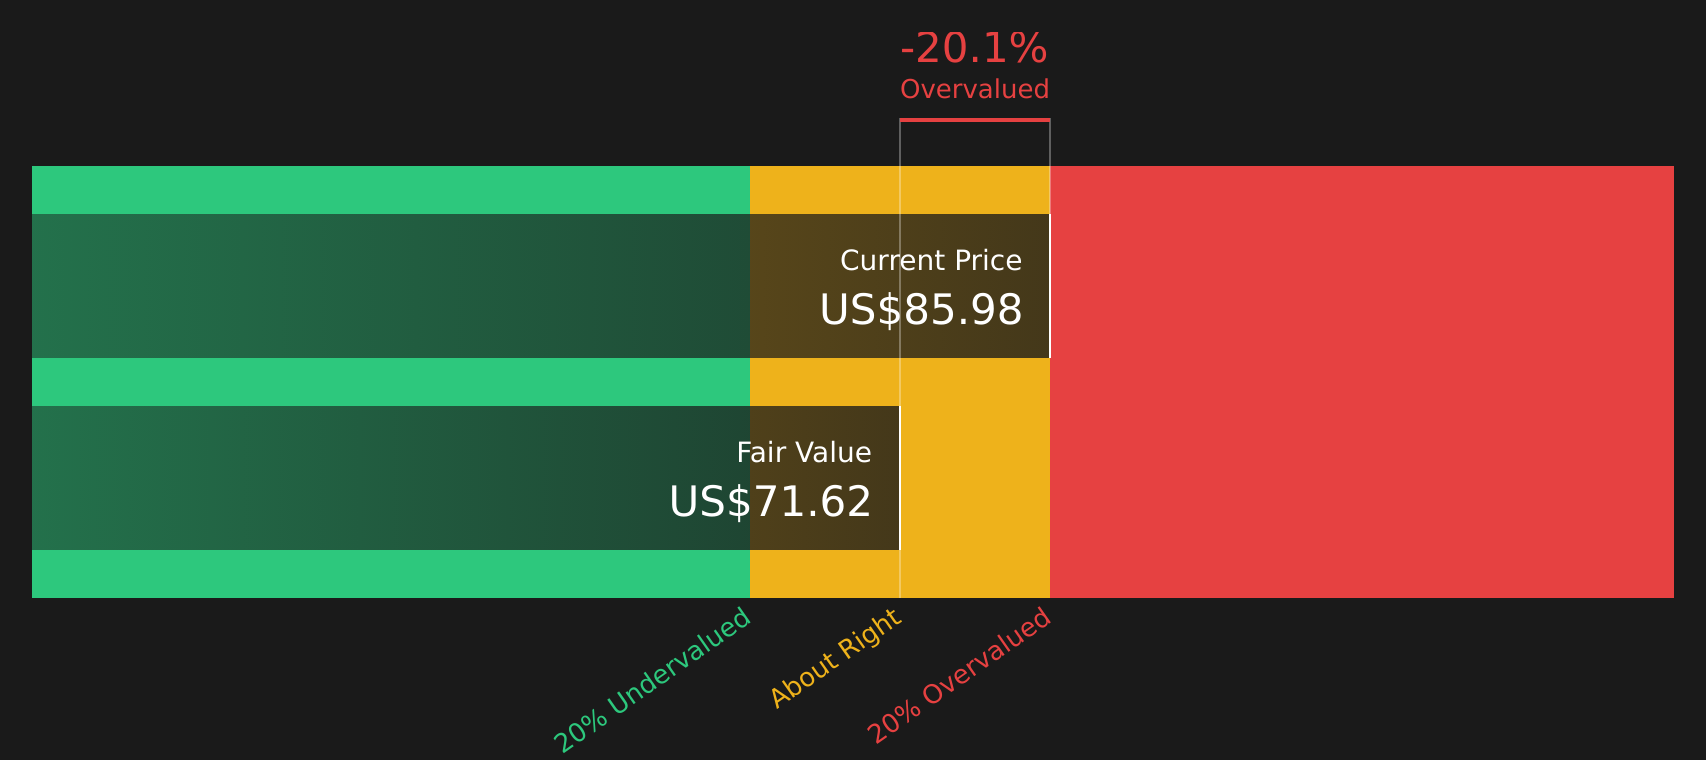
Based on these inputs, the DDM arrives at an estimated intrinsic value of about US$68.11 per share. Compared with the recent share price of US$85.10, that implies the stock is about 25.0% above the model’s estimate, which indicates that Otter Tail may be trading on the rich side when viewed purely through its dividend stream today.
Result: OVERVALUED
Our Dividend Discount Model (DDM) analysis suggests Otter Tail may be overvalued by 25.0%. Discover 46 high quality undervalued stocks or create your own screener to find better value opportunities.
Approach 2: Otter Tail Price vs Earnings
For a profitable company like Otter Tail, the P/E ratio is a useful yardstick because it links what you pay for each share directly to the earnings that support that share. Investors typically accept a higher P/E when they see stronger growth potential or lower perceived risk, and a lower P/E when growth expectations are more muted or risks feel higher.
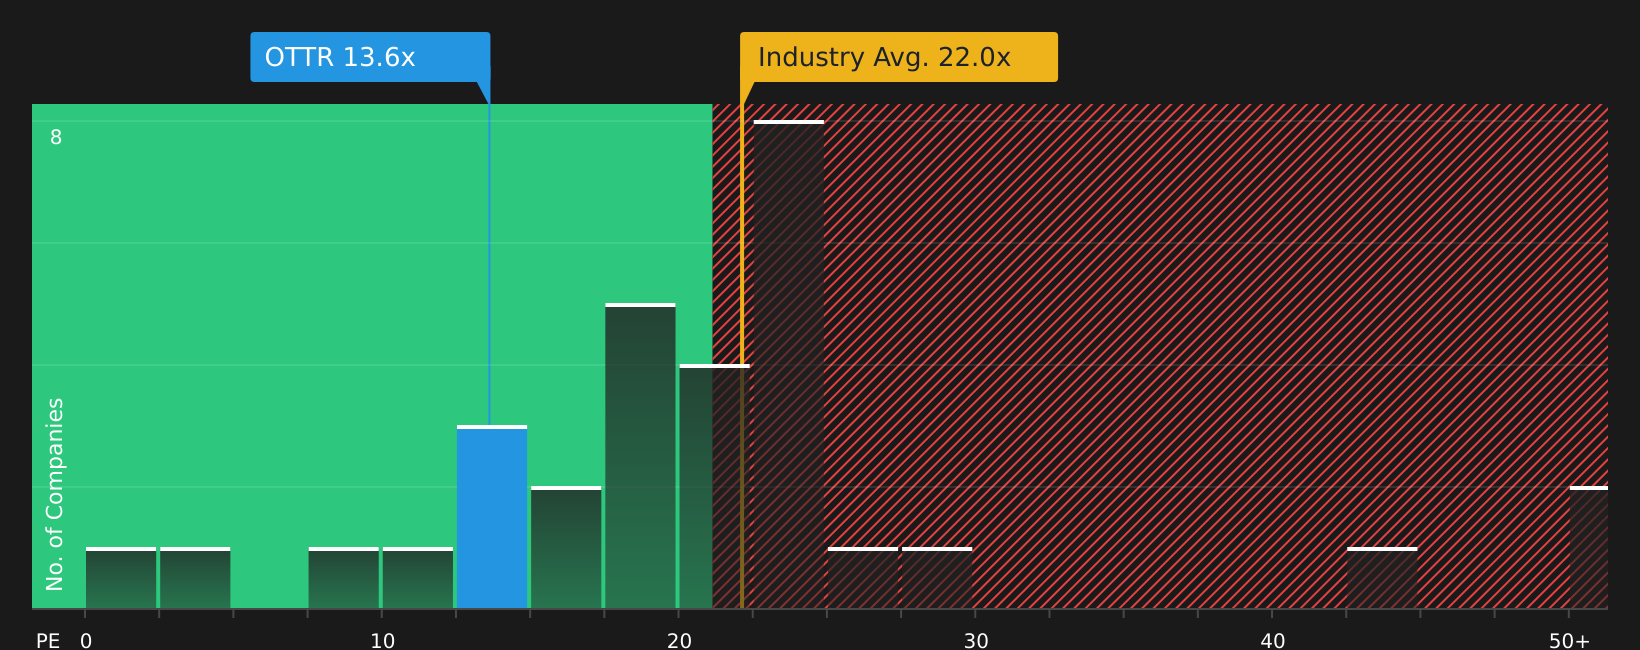
Otter Tail currently trades on a P/E of about 12.9x. That sits below the Electric Utilities industry average of about 22.7x and also below the peer group average of around 26.6x. On the surface, that points to a lower valuation than many comparable names. However, simple comparisons like these do not adjust for the company’s own earnings growth profile, profitability, size or risk.
Simply Wall St’s Fair Ratio for Otter Tail is 11.4x. This proprietary figure is designed to be more tailored than a straight industry or peer comparison because it brings together factors such as earnings growth, profit margins, industry, market cap and risk. Setting this Fair Ratio against the current 12.9x P/E suggests the shares are pricing in more optimism than the model implies.
Result: OVERVALUED
P/E ratios tell one story, but what if the real opportunity lies elsewhere? Start investing in legacies, not executives. Discover our 19 top founder-led companies.
Upgrade Your Decision Making: Choose your Otter Tail Narrative
Earlier we mentioned that there is an even better way to understand valuation. On Simply Wall St’s Community page you can use Narratives to connect your view of Otter Tail’s story with your own forecast for revenue, earnings and margins. You can then link that forecast to a Fair Value and compare it with the current price. The platform updates your Narrative automatically when fresh news or earnings arrive. Different investors can, for example, set one Narrative that leans into regulatory and cost risks with a lower Fair Value, and another that leans into utility investment, diversification and cost advantages with a higher Fair Value. All of this is presented in a format that stays transparent and easy to adjust as your thinking evolves.
Do you think there's more to the story for Otter Tail? Head over to our Community to see what others are saying!

This article by Simply Wall St is general in nature. We provide commentary based on historical data and analyst forecasts only using an unbiased methodology and our articles are not intended to be financial advice. It does not constitute a recommendation to buy or sell any stock, and does not take account of your objectives, or your financial situation. We aim to bring you long-term focused analysis driven by fundamental data. Note that our analysis may not factor in the latest price-sensitive company announcements or qualitative material. Simply Wall St has no position in any stocks mentioned.
Have feedback on this article? Concerned about the content? Get in touch with us directly. Alternatively, email editorial-team@simplywallst.com