

Is Carrier Global (CARR) Fairly Priced After Recent 34% Three Year Share Price Gain
- If you are wondering whether Carrier Global's current share price lines up with its underlying worth, this valuation focused breakdown is designed to give you a clear and structured view.
- The stock recently closed at US$61.17, with returns of 2.7% over the last 30 days, 14.3% year to date and 34.2% over 3 years, which may have some investors reassessing both its growth potential and risk profile.
- Recent coverage has focused on Carrier Global's position as a major player in heating, ventilation and air conditioning, and how its scale and brand recognition keep it central to discussions about building efficiency and climate control solutions. These themes often frame how investors interpret the share price moves you have seen over the past weeks and years.
- On our checks based valuation framework, Carrier Global currently scores 2 out of 6. Next we will look at how different valuation approaches view the stock and then finish by looking at a broader way to think about what valuation really tells you as an investor.
Carrier Global scores just 2/6 on our valuation checks. See what other red flags we found in the full valuation breakdown.
Approach 1: Carrier Global Discounted Cash Flow (DCF) Analysis
A Discounted Cash Flow, or DCF, model estimates what a business could be worth by projecting its future cash flows and then discounting those cash flows back to today to get a single present value figure.
For Carrier Global, the model used is a 2 Stage Free Cash Flow to Equity approach, based on cash flow projections in US$. The latest twelve month free cash flow stands at about US$2.0b. Analyst and extrapolated estimates suggest free cash flow reaching around US$3.1b by 2029, with a series of annual projections in between that are discounted back using a required rate of return.
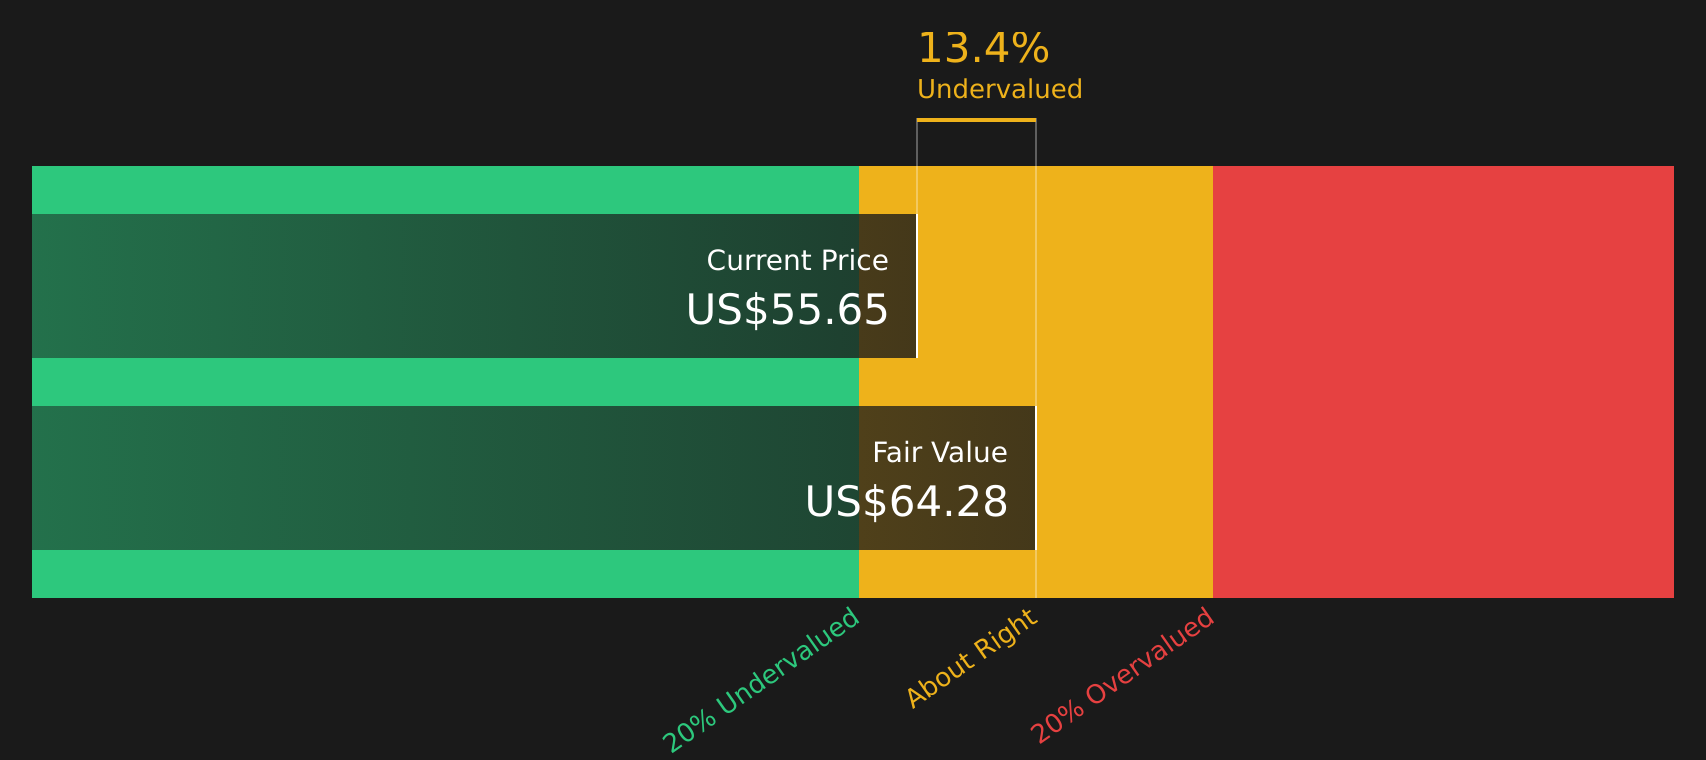
Combining these discounted cash flows, the model arrives at an estimated intrinsic value of US$66.10 per share. Compared with the recent share price of US$61.17, this implies a discount of about 7.5%, which the model interprets as a modest gap between price and estimated value rather than a dramatic mismatch.
Result: ABOUT RIGHT
Carrier Global is fairly valued according to our Discounted Cash Flow (DCF), but this can change at a moment's notice. Track the value in your watchlist or portfolio and be alerted on when to act.
Approach 2: Carrier Global Price vs Earnings
For profitable companies like Carrier Global, the P/E ratio is a useful way to check how much you are paying for each dollar of earnings. It links the share price directly to the business’s current earnings power, which most investors watch closely.
What counts as a “normal” P/E depends a lot on how the market views a company’s growth prospects and risk. Higher expected earnings growth or a business seen as more resilient can justify a higher P/E, while lower growth expectations or higher perceived risk usually point to a lower P/E.
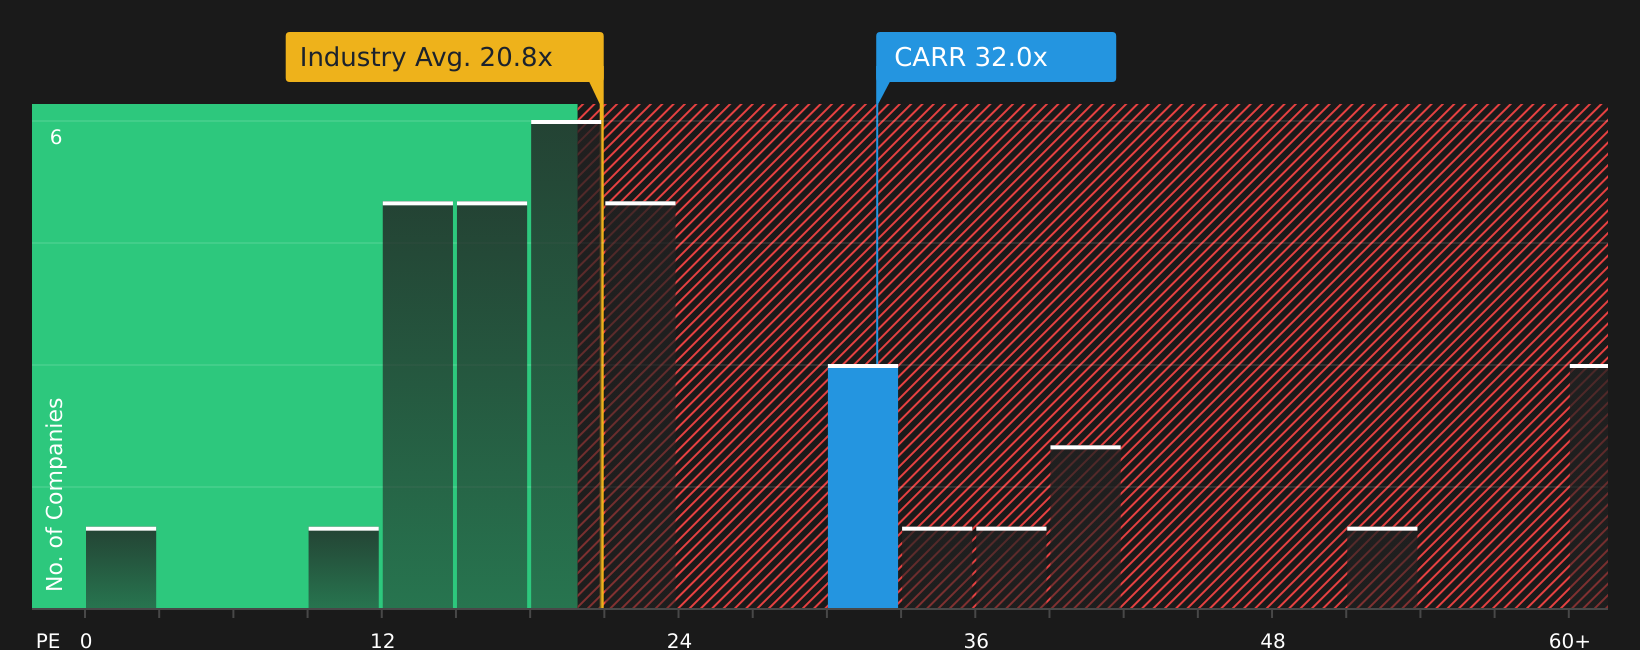
Carrier Global is trading on a P/E of 35.14x, compared with an industry average of 23.00x for Building companies and a peer average of 30.82x. Simply Wall St’s Fair Ratio for Carrier Global is 40.85x. The Fair Ratio is a proprietary estimate of what a reasonable P/E could be for this company after taking into account factors such as its earnings growth profile, industry, profit margins, market cap and specific risks. This makes it a more tailored reference point than a simple comparison with peers or the broad industry, which may differ on growth, quality and risk.
On this basis, Carrier Global’s current P/E of 35.14x sits below the Fair Ratio of 40.85x, which indicates that the shares are trading at a discount to that company specific benchmark.
Result: UNDERVALUED
P/E ratios tell one story, but what if the real opportunity lies elsewhere? Start investing in legacies, not executives. Discover our 18 top founder-led companies.
Upgrade Your Decision Making: Choose your Carrier Global Narrative
Earlier we mentioned that there is an even better way to understand valuation, so let us introduce you to Narratives, which are simply your own story about Carrier Global, tied to specific assumptions for future revenue, earnings, margins and a fair value that you can compare with today’s share price. On Simply Wall St’s Community page, millions of investors use Narratives to connect their view of the business to a forecast and then to a fair value, so they can see at a glance whether their story says the stock is above or below their number and decide how that lines up with their own timing. These Narratives update automatically as new data, news or earnings are added, so your fair value view stays current without you needing to rebuild a model each time. For Carrier Global, one user might lean closer to a higher fair value such as about US$89.13 if they think data center cooling, European heat pump adoption and aftermarket growth support that story, while another might anchor on a lower fair value such as about US$55.00 if they focus more on residential softness, factory under absorption and tighter P/E assumptions.
For Carrier Global, here are previews of two leading Carrier Global Narratives to make comparison easier:
🐂 Carrier Global Bull CaseFair value in this narrative: US$71.66 per share
Implied discount to this fair value: about 14.6% compared to the recent price of US$61.17
Revenue growth assumption in this narrative: 4.12% per year
- Focuses on Carrier Global capturing demand in sustainable energy, heat pumps and data center cooling, with products such as advanced commercial heat pumps and AI enabled home energy management.
- Builds in higher margins over time, supported by aftermarket services, Viessmann integration and cost efficiency efforts.
- Anchors on analyst assumptions for revenue, earnings and P/E that together support a fair value above the recent share price, while pointing out regional and tariff risks that investors may want to monitor.
Fair value in this narrative: US$55.00 per share
Implied premium to this fair value: about 11.2% compared to the recent price of US$61.17
Revenue growth assumption in this narrative: 3.35% per year
- Highlights concentration risk in data center cooling and softer residential and European boiler demand, which could keep certain segments and margins under pressure.
- Assumes a lower future P/E multiple of 18.2x, paired with more modest revenue growth, even though earnings are expected to be higher than today.
- Frames US$55.00 as a fair value that aligns with more cautious analysts, who see the current share price as close to or above what those assumptions support.
Together, these two Narratives illustrate how different assumptions around growth, margins and the P/E you are willing to pay can lead to very different views on what Carrier Global may be worth today.
Curious how numbers become stories that shape markets? Explore Community Narratives
Do you think there's more to the story for Carrier Global? Head over to our Community to see what others are saying!

This article by Simply Wall St is general in nature. We provide commentary based on historical data and analyst forecasts only using an unbiased methodology and our articles are not intended to be financial advice. It does not constitute a recommendation to buy or sell any stock, and does not take account of your objectives, or your financial situation. We aim to bring you long-term focused analysis driven by fundamental data. Note that our analysis may not factor in the latest price-sensitive company announcements or qualitative material. Simply Wall St has no position in any stocks mentioned.
Have feedback on this article? Concerned about the content? Get in touch with us directly. Alternatively, email editorial-team@simplywallst.com