


- If you are wondering whether Dolby Laboratories' share price lines up with its true worth, you are not alone. The stock often attracts attention from investors focused on what they are really paying for its audio technology franchise.
- Dolby recently closed at US$65.52, with returns of 0.1% over 7 days, 7.3% over 30 days and 3.1% year to date. However, the 1 year, 3 year and 5 year returns of 19.0%, 15.7% and 28.3% declines show a mixed picture for longer term holders.
- These moves are set against ongoing interest in Dolby's role in audio and visual technologies across entertainment and consumer electronics. Investors are paying attention to how its licensing model and partnerships position it in those markets. While the news backdrop helps explain why some investors are reassessing the stock, the key question is whether the current price already reflects those expectations.
- On Simply Wall St's valuation checks, Dolby scores a 5 out of 6 for being undervalued. Next we will look at how different valuation approaches arrive at that view, before finishing with a way to think about value that goes beyond any single model.
Find out why Dolby Laboratories's -19.0% return over the last year is lagging behind its peers.
Approach 1: Dolby Laboratories Discounted Cash Flow (DCF) Analysis
A Discounted Cash Flow, or DCF, model takes the cash Dolby Laboratories is expected to generate in the future, then discounts those cash flows back to today to estimate what the business could be worth now.
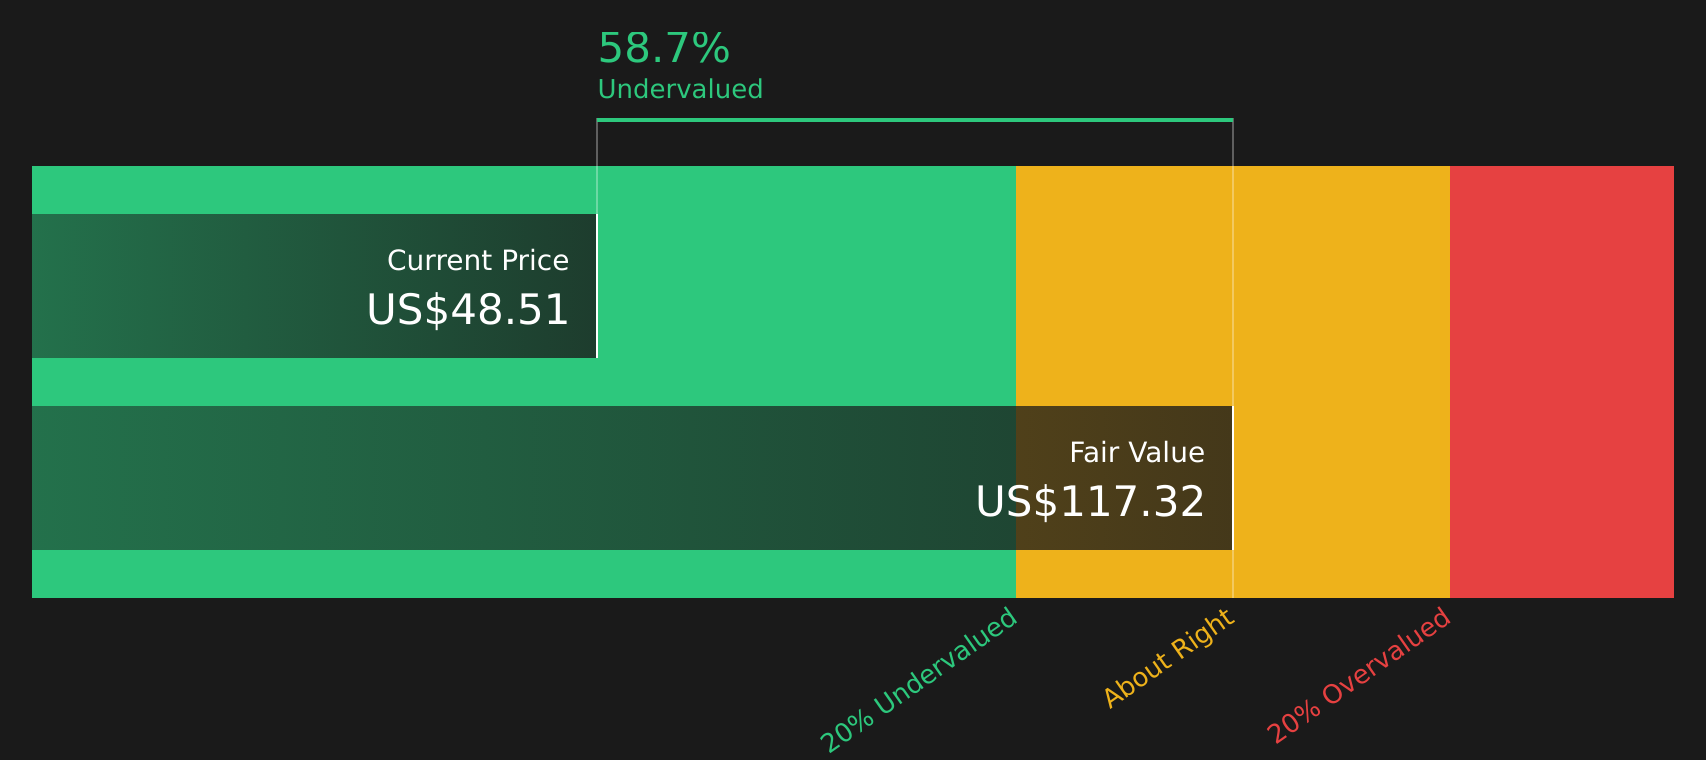
For Dolby, the latest twelve month Free Cash Flow is about $386.6 million. Using a 2 Stage Free Cash Flow to Equity model, analysts first project cash flows explicitly, then Simply Wall St extrapolates further into the future. For example, projected Free Cash Flow for 2026 is $412.9 million, rising in this model to $752.3 million by 2035, all expressed in US dollars and then discounted back to today.
When all those discounted cash flows are added together, the model arrives at an estimated intrinsic value of about $111.07 per share. Compared with the recent share price of $65.52, this implies Dolby trades at a 41.0% discount to that DCF estimate, based on this specific cash flow based approach.
Result: UNDERVALUED
Our Discounted Cash Flow (DCF) analysis suggests Dolby Laboratories is undervalued by 41.0%. Track this in your watchlist or portfolio, or discover 47 more high quality undervalued stocks.
Approach 2: Dolby Laboratories Price vs Earnings
For a profitable company like Dolby Laboratories, the P/E ratio is a useful way to relate what you are paying per share to the earnings the business is currently generating. Investors usually accept a higher P/E when they expect stronger earnings growth or see lower risk, while slower growth or higher risk tends to justify a lower, more conservative P/E.
Dolby currently trades on a P/E of 26.0x, compared with the Software industry average of about 26.9x and a peer group average of 27.5x. Simply Wall St also calculates a Fair Ratio of 24.0x, which is the P/E level it considers appropriate given Dolby’s earnings growth profile, industry, profit margins, market cap and risk factors.
This Fair Ratio is intended to be more tailored than a simple comparison with peers or the broad industry, because it adjusts for Dolby’s specific fundamentals rather than assuming all software companies deserve the same multiple. When set against the current P/E of 26.0x, the Fair Ratio of 24.0x suggests the shares are somewhat expensive on this metric.
Result: OVERVALUED

P/E ratios tell one story, but what if the real opportunity lies elsewhere? Start investing in legacies, not executives. Discover our 20 top founder-led companies.
Upgrade Your Decision Making: Choose your Dolby Laboratories Narrative
Earlier we mentioned that there is an even better way to understand valuation, so let us introduce you to Narratives, which simply means attaching a clear story about Dolby Laboratories to the numbers you are using for fair value, revenue, earnings and margins, then seeing how that story stacks up against the current share price.
On Simply Wall St, Narratives sit in the Community page and let you link a company story to a forecast and then to a fair value in a way that is easy to follow and adjust as your view changes.
They also help you outline potential approaches to a stock by comparing Fair Value from your chosen Narrative to the live market Price, so you can see at a glance if your story implies Dolby is expensive or cheap on your numbers.
Because Narratives update when new information is added, such as earnings results or news about Dolby’s partnerships, you are not locked into a static spreadsheet that goes out of date as soon as something changes.
For Dolby, one investor might build a more cautious Narrative around a Fair Value of about US$68.00, while another might lean into a more optimistic story with Fair Value closer to US$114.00, and both perspectives can coexist on the platform so you can quickly see how your own view compares.
Do you think there's more to the story for Dolby Laboratories? Head over to our Community to see what others are saying!

This article by Simply Wall St is general in nature. We provide commentary based on historical data and analyst forecasts only using an unbiased methodology and our articles are not intended to be financial advice. It does not constitute a recommendation to buy or sell any stock, and does not take account of your objectives, or your financial situation. We aim to bring you long-term focused analysis driven by fundamental data. Note that our analysis may not factor in the latest price-sensitive company announcements or qualitative material. Simply Wall St has no position in any stocks mentioned.
Have feedback on this article? Concerned about the content? Get in touch with us directly. Alternatively, email editorial-team@simplywallst.com