


- If you are looking at TXNM Energy and wondering whether the current share price really lines up with its underlying value, you are not alone.
- The stock closed at US$58.88 recently, with a 26.9% return over 1 year. This compares with small moves of a 0.2% decline over 7 days, a 0.1% decline over 30 days and a 0.3% decline year to date.
- Recent coverage around TXNM Energy has focused on its role in the US utilities sector and how investors are treating the stock as part of a longer term energy transition theme. This has helped frame the share price performance as investors weigh its position in a regulated, cash flow focused industry against changing expectations for future demand and capital needs.
- Right now, TXNM Energy carries a valuation score of 0 out of 6. This suggests there is plenty to unpack as we compare different valuation approaches and, later in the article, look at a way of thinking about value that goes beyond the standard checks.
TXNM Energy scores just 0/6 on our valuation checks. See what other red flags we found in the full valuation breakdown.
Approach 1: TXNM Energy Dividend Discount Model (DDM) Analysis
The Dividend Discount Model estimates what a stock might be worth by projecting future dividends and discounting them back to today, based on an assumed growth rate. It is useful if you see the company primarily as an income investment.
For TXNM Energy, the latest data shows dividends per share of US$1.83, a return on equity of 7.54% and a payout ratio of about 79.8%. That payout level means most earnings are paid out, with a smaller portion retained to support future growth. Using the classic DDM formula, this gives a dividend growth rate of about 1.52%, calculated as the product of the earnings retention rate and return on equity.
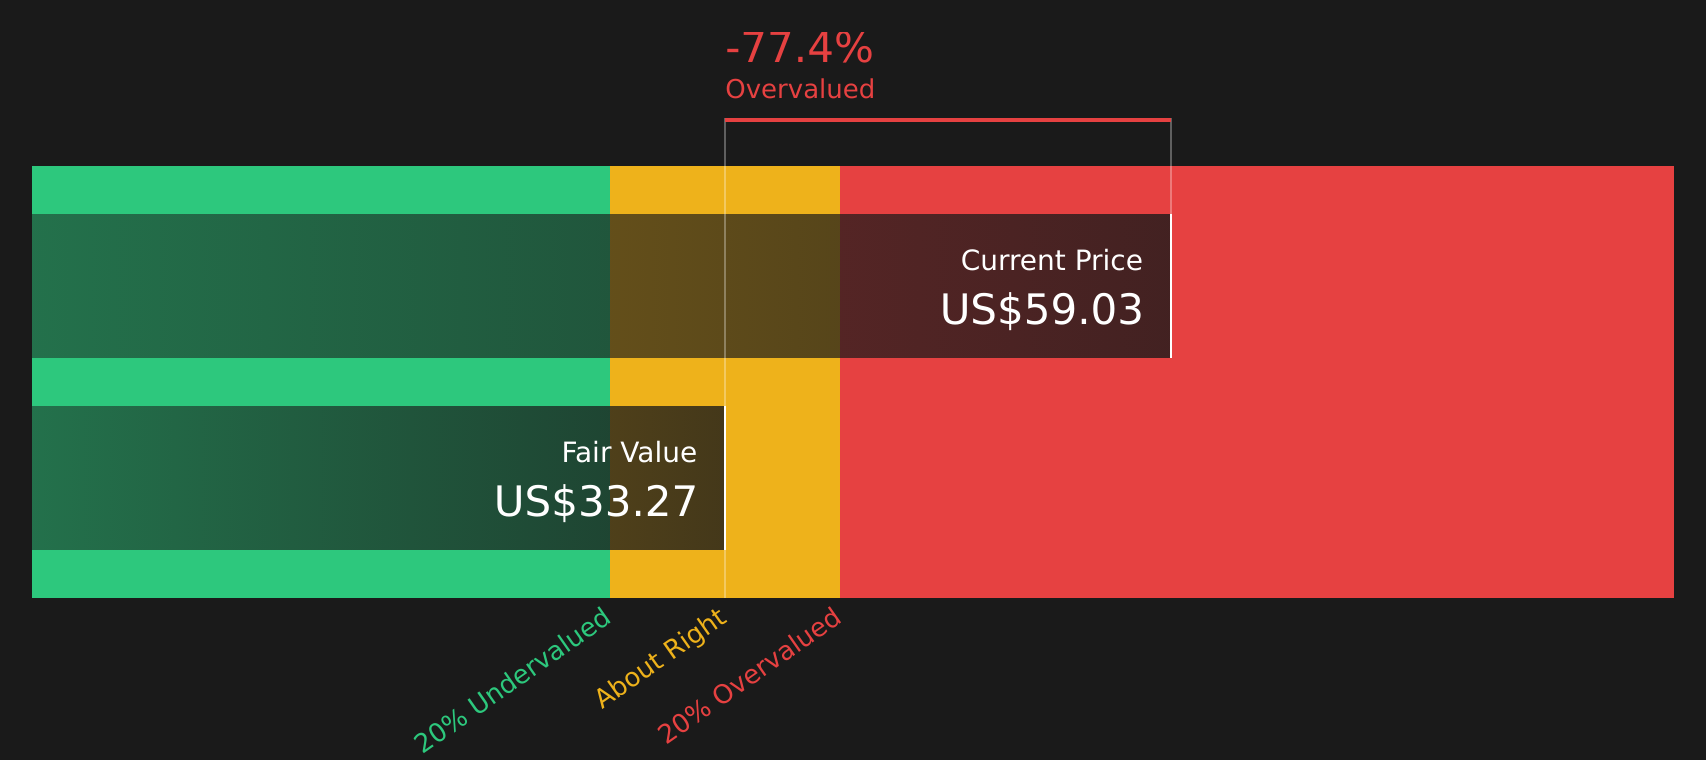
On these inputs, the DDM framework produces an estimated intrinsic value of about US$33.64 per share. Compared with the recent market price of US$58.88, the model implies the stock is around 75.0% overvalued based purely on dividend assumptions and growth.
Result: OVERVALUED
Our Dividend Discount Model (DDM) analysis suggests TXNM Energy may be overvalued by 75.0%. Discover 49 high quality undervalued stocks or create your own screener to find better value opportunities.
Approach 2: TXNM Energy Price vs Earnings
For a profitable company like TXNM Energy, the P/E ratio is a useful shorthand for how much you are paying for each dollar of earnings. It ties directly to what the business is generating today, which many investors find easier to relate to than cash flow models.
What counts as a "normal" P/E depends on how the market views a company’s growth potential and risk. Higher expected growth or lower perceived risk can support a higher multiple, while lower growth or higher risk usually calls for a lower, more cautious P/E.
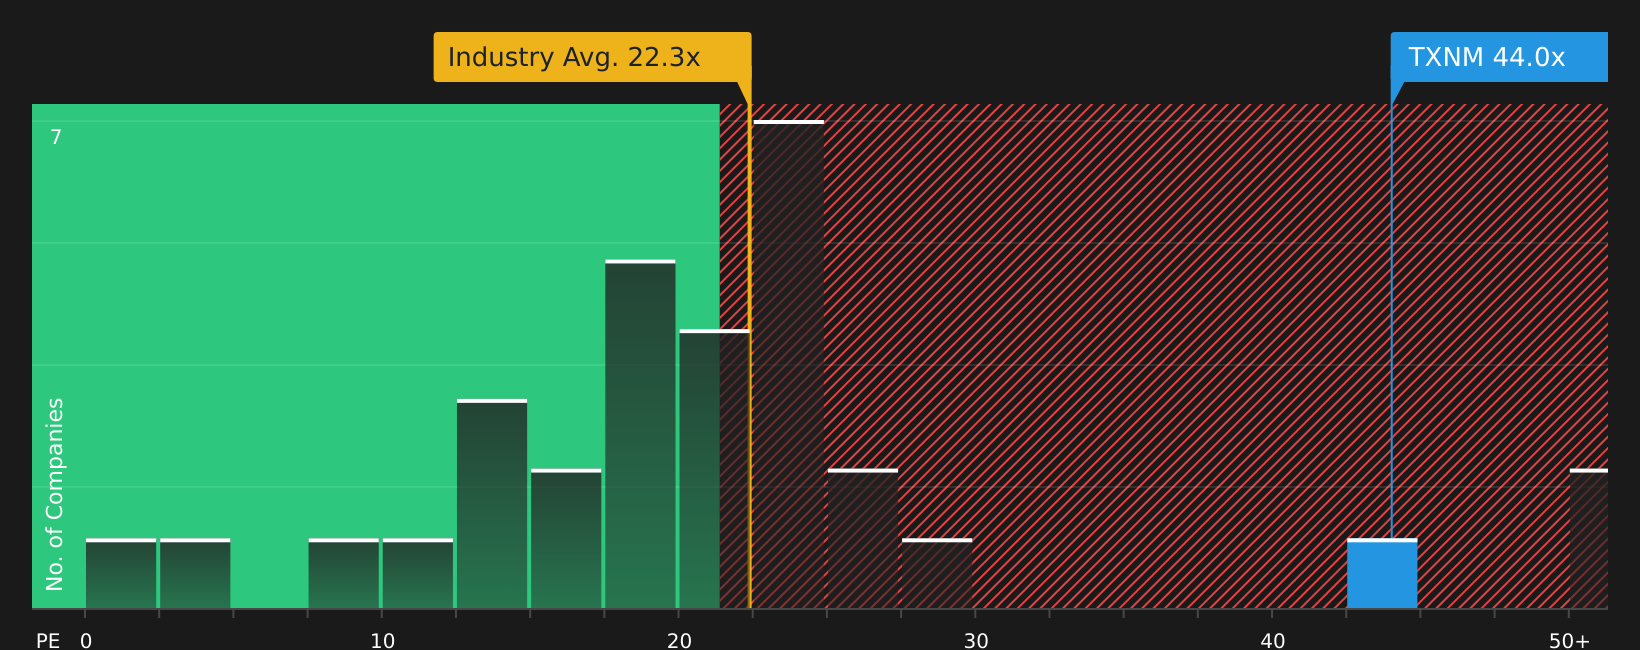
TXNM Energy currently trades on a P/E of 42.37x. That sits above the Electric Utilities industry average of 21.96x and above the peer group average of 19.79x. On simple comparisons, the stock is priced more richly than many similar names.
Simply Wall St’s Fair Ratio is designed to refine that picture by estimating what P/E might make sense given TXNM Energy’s own earnings growth profile, industry, profit margins, market cap and risk factors. Because it is company specific, the Fair Ratio can be more informative than broad industry or peer averages, which may mix very different businesses together.
With no Fair Ratio figure available here, you are left comparing the current 42.37x P/E mainly against those benchmarks, which both point to a higher than typical earnings multiple for this sector.
Result: OVERVALUED
P/E ratios tell one story, but what if the real opportunity lies elsewhere? Start investing in legacies, not executives. Discover our 20 top founder-led companies.
Upgrade Your Decision Making: Choose your TXNM Energy Narrative
Earlier we mentioned that there is an even better way to understand valuation, so let us introduce you to Narratives. In this approach, you write a simple story about TXNM Energy that links what you think will happen to its revenue, earnings and margins with a financial forecast, a fair value and a clear comparison to today’s price. All of this is done within an easy tool on Simply Wall St’s Community page that updates automatically when new earnings or news arrive. For example, one investor might build a TXNM Energy Narrative around growing grid investment, higher future margins and a fair value near US$60.79. Another might focus on regulatory and cost risks and prefer a much lower fair value. Both can then use their own fair value versus the current share price to decide whether the stock looks appealing, fully priced or expensive.
Do you think there's more to the story for TXNM Energy? Head over to our Community to see what others are saying!

This article by Simply Wall St is general in nature. We provide commentary based on historical data and analyst forecasts only using an unbiased methodology and our articles are not intended to be financial advice. It does not constitute a recommendation to buy or sell any stock, and does not take account of your objectives, or your financial situation. We aim to bring you long-term focused analysis driven by fundamental data. Note that our analysis may not factor in the latest price-sensitive company announcements or qualitative material. Simply Wall St has no position in any stocks mentioned.
Have feedback on this article? Concerned about the content? Get in touch with us directly. Alternatively, email editorial-team@simplywallst.com