


- If you are wondering whether Arlo Technologies' current share price still represents good value, this article will walk through what the numbers actually say about the stock.
- Arlo's share price recently closed at US$13.51, with returns of 9.2% over 30 days, 2.1% year to date, 28.3% over 1 year and 129.4% over 3 years. These figures may have changed how some investors view its potential and its risks.
- Recent news around Arlo has focused on its position in connected home security and smart devices, as investors weigh how its product set fits into broader technology trends. This context is important for understanding why the stock's performance over the last year and the last 3 years looks the way it does.
- Arlo currently has a valuation score of 3 out of 6. This means it screens as undervalued on half of the checks we run. Next we will look at what traditional valuation methods say about that score before closing with a different way to think about value altogether.
Find out why Arlo Technologies's 28.3% return over the last year is lagging behind its peers.
Approach 1: Arlo Technologies Discounted Cash Flow (DCF) Analysis
A Discounted Cash Flow, or DCF, model takes the cash Arlo Technologies is expected to generate in the future and discounts those amounts back to what they may be worth in today's dollars. The idea is simple: what matters is the cash the business could return to shareholders over time.
For Arlo, the model uses a 2 Stage Free Cash Flow to Equity approach based on cash flow projections. The latest twelve month free cash flow is about $72.7 million. Simply Wall St then projects annual free cash flow out to 2035. For example, it estimates about $213.8 million in 2035, with earlier years stepping up between these points. Analysts typically provide estimates for up to 5 years, so the later years are extrapolated rather than based on explicit analyst forecasts.
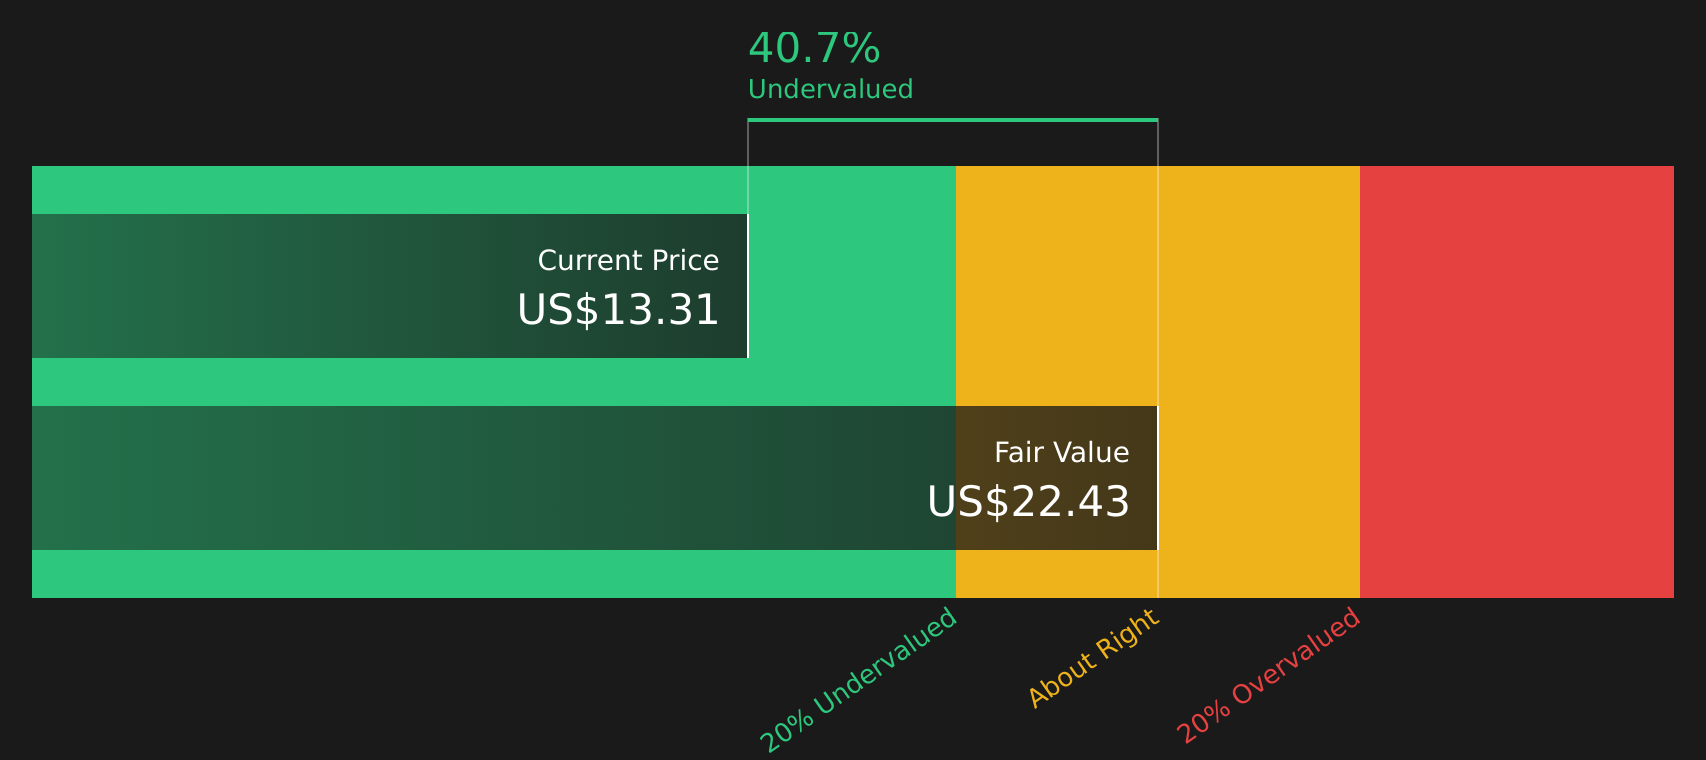
After discounting those projected cash flows back to today, the model arrives at an estimated intrinsic value of about $28.51 per share. Compared with the recent share price of US$13.51, this output indicates that, on this DCF view, the stock appears to trade at a discount to the model's estimated value.
Result: UNDERVALUED
Our Discounted Cash Flow (DCF) analysis suggests Arlo Technologies is undervalued by 52.6%. Track this in your watchlist or portfolio, or discover 48 more high quality undervalued stocks.
Approach 2: Arlo Technologies Price vs Earnings
For profitable companies, the P/E ratio is a useful way to think about value because it links what you pay for each share to the earnings that the business is currently generating. In general, higher growth expectations and lower perceived risk can justify a higher P/E, while lower growth expectations and higher risk tend to point to a lower, more conservative P/E being appropriate.
Arlo Technologies currently trades on a P/E of 96.72x, compared with an electronic industry average of about 28.25x and a peer group average of 24.78x. Simply Wall St also calculates a proprietary “Fair Ratio” for Arlo of 46.69x. This Fair Ratio is designed to reflect what P/E might make sense for the company given factors such as its earnings growth profile, industry, profit margins, market cap and specific risks.
Because the Fair Ratio is tailored to the company, it can be more informative than a simple comparison with peers or sector averages, which may differ in size, growth, or risk. Against this Fair Ratio of 46.69x, Arlo’s actual P/E of 96.72x screens as materially higher. This indicates that the shares appear expensive on this metric.
Result: OVERVALUED

P/E ratios tell one story, but what if the real opportunity lies elsewhere? Start investing in legacies, not executives. Discover our 19 top founder-led companies.
Upgrade Your Decision Making: Choose your Arlo Technologies Narrative
Earlier we mentioned that there is an even better way to understand valuation, so let us introduce you to Narratives, which are simply your story about a company linked directly to your own estimates for its future revenue, earnings, margins, and the fair value you think those numbers support.
A Narrative on Simply Wall St connects three things in one place: how you see Arlo Technologies’ business story, the financial forecast that flows from that view, and the fair value that drops out of those assumptions, all within an easy tool on the Community page used by millions of investors.
Once you set up a Narrative, the platform compares your Fair Value to the current share price so you can decide for yourself how the gap between Price and Fair Value makes Arlo look in the context of your portfolio.
Because Narratives are updated when new information such as news, guidance or earnings arrives, you can quickly see how a change in, for example, revenue expectations or margins might shift your view on Arlo, whether you lean closer to a higher fair value view around US$26.00 or a more cautious one nearer US$22.00.
Do you think there's more to the story for Arlo Technologies? Head over to our Community to see what others are saying!

This article by Simply Wall St is general in nature. We provide commentary based on historical data and analyst forecasts only using an unbiased methodology and our articles are not intended to be financial advice. It does not constitute a recommendation to buy or sell any stock, and does not take account of your objectives, or your financial situation. We aim to bring you long-term focused analysis driven by fundamental data. Note that our analysis may not factor in the latest price-sensitive company announcements or qualitative material. Simply Wall St has no position in any stocks mentioned.
Have feedback on this article? Concerned about the content? Get in touch with us directly. Alternatively, email editorial-team@simplywallst.com