


- If you are wondering whether Avista's current share price lines up with its underlying value, this article will walk through what the key numbers are really saying.
- Over the past week Avista has a 0.5% return, compared with a 7.5% decline over the last 30 days and returns of 3.0% year to date and 4.9% over 1 year, with a 3 year return of 11.7% and 5 year return of 8.8% that can help frame how the current US$39.87 share price fits into its recent history.
- Recent price moves have come against a backdrop of ongoing sector wide focus on regulated utilities, with investors often weighing income characteristics against interest rate expectations. For Avista, that context makes it especially useful to check whether the stock now looks expensive or potentially offers better value than it did earlier in its return history.
- On Simply Wall St's 6 point valuation check, Avista scores a 3. This means it screens as undervalued on half of those measures. Next, we will walk through the main valuation approaches before finishing with a tool that many investors find even more helpful for judging value over time.
Find out why Avista's 4.9% return over the last year is lagging behind its peers.
Approach 1: Avista Dividend Discount Model (DDM) Analysis
The Dividend Discount Model looks at a stock by asking a simple question: if you only cared about the stream of future dividends, what would those be worth in today's dollars?
For Avista, the model uses an annual dividend per share of US$2.12, a return on equity of 7.10% and a payout ratio of 83.07%. That payout leaves limited room for reinvestment, so the implied dividend growth rate is a modest 1.20%, calculated as the product of the retention rate and ROE, as shown in the source data: Calculated (1 - Payout Ratio) x ROE, (1 - 83.07%) x 7.10%).
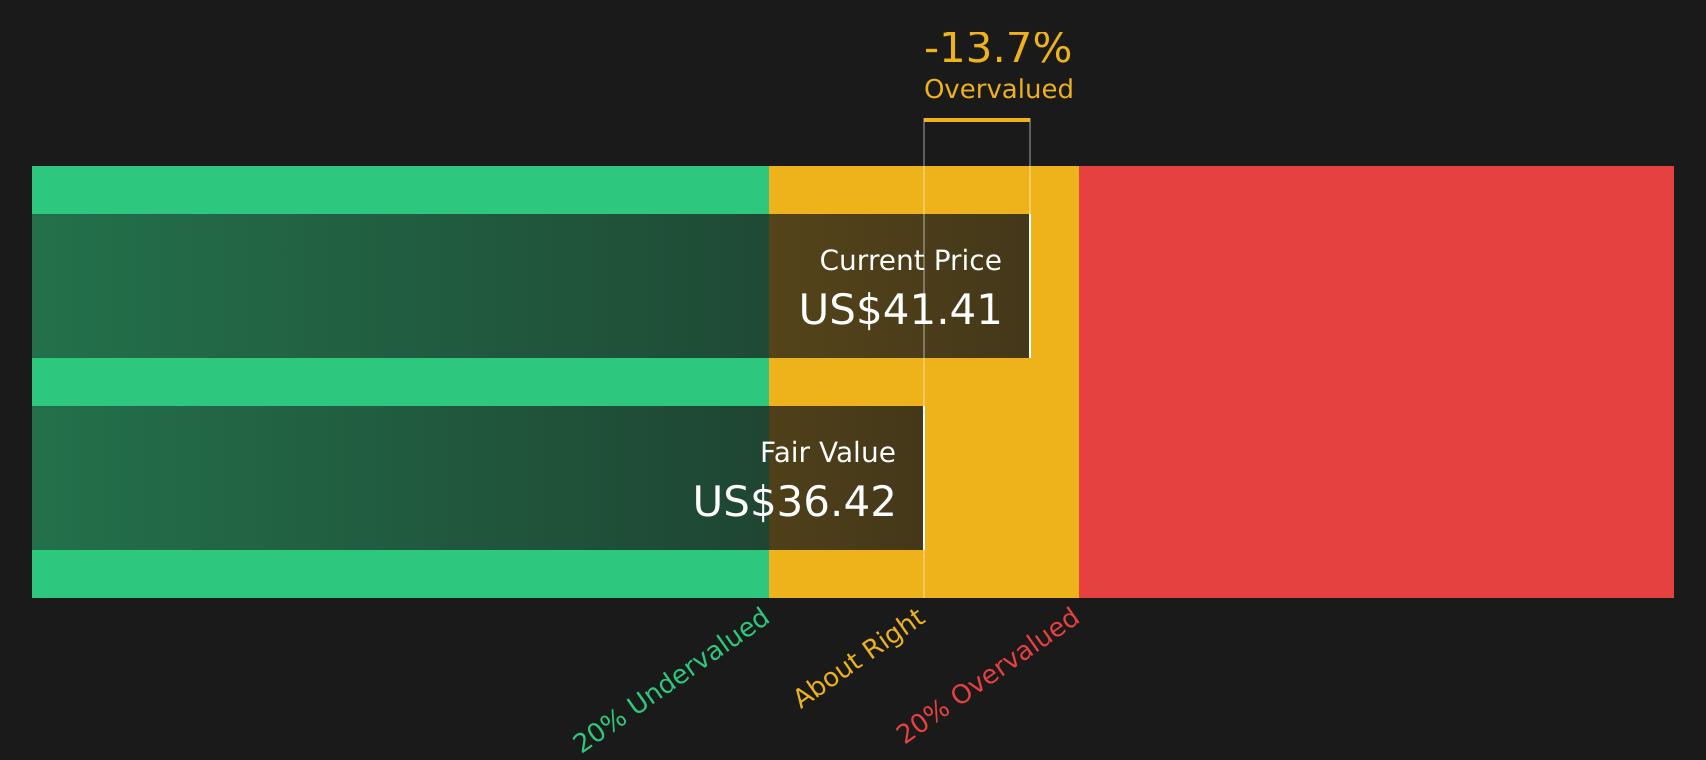
Feeding these inputs into the DDM results in an estimated intrinsic value of about US$36.78 per share, compared with the current share price of around US$39.87. That comparison indicates Avista screens as roughly 8.4% more expensive than its DDM value, which suggests the current price already reflects much of the expected dividend stream.
Result: ABOUT RIGHT
Avista is fairly valued according to our Dividend Discount Model (DDM), but this can change at a moment's notice. Track the value in your watchlist or portfolio and be alerted on when to act.
Approach 2: Avista Price vs Earnings
For a profitable company like Avista, the P/E ratio is a useful way to gauge what you are paying for each dollar of earnings. This is often how income focused and long term investors compare utilities.
What counts as a “normal” or “fair” P/E depends on how the market views a company’s growth prospects and risk profile. Higher expected earnings growth or lower perceived risk can justify a higher P/E, while slower growth or higher risk usually lines up with a lower multiple.
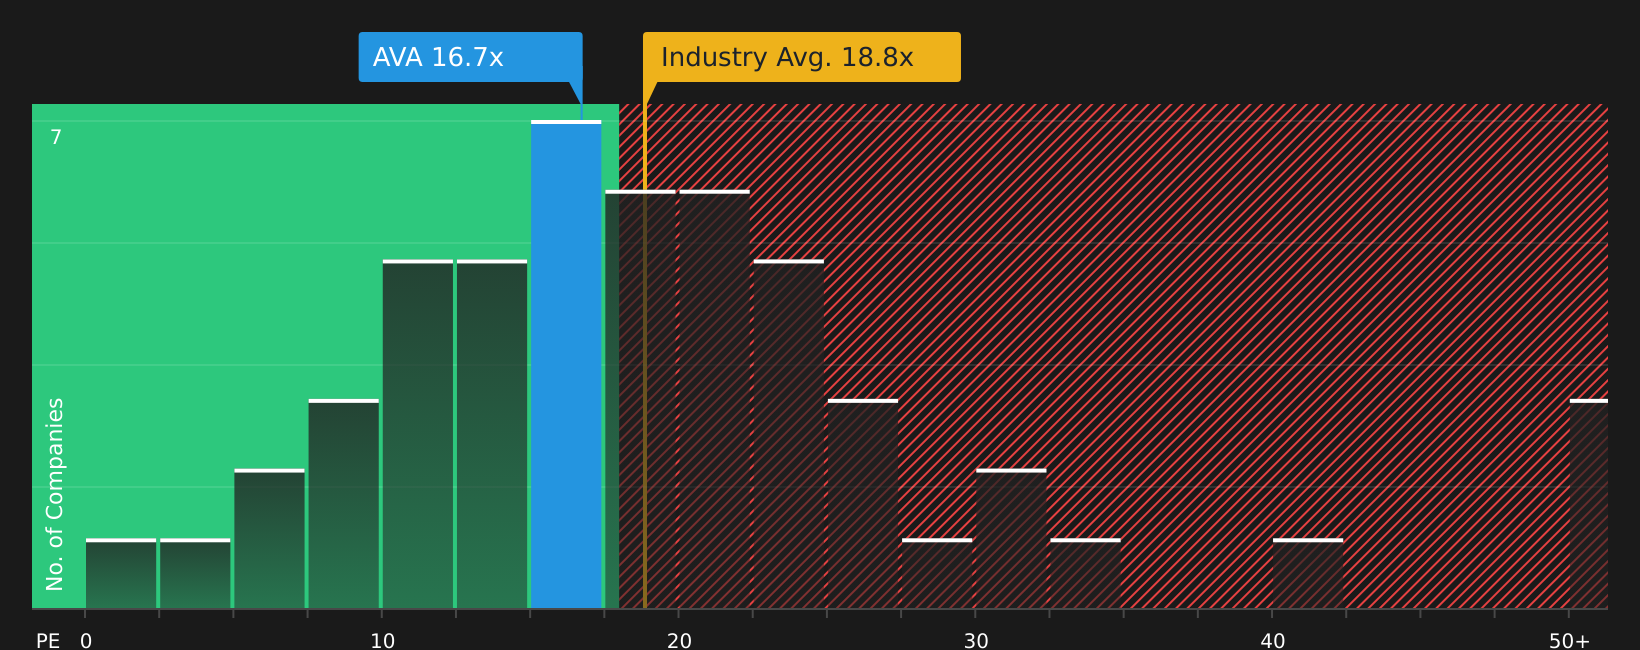
Avista is currently trading on a P/E of 16.99x. That sits below the Integrated Utilities industry average P/E of 19.33x and also below the peer group average of 24.98x. Simply Wall St’s Fair Ratio for Avista is 18.77x, which is its proprietary view of what the P/E “should” be given factors such as earnings growth, profit margins, industry, market cap and key risks. Because the Fair Ratio adjusts for these company specific features, it can be more informative than a simple comparison with peers or the sector alone.
Here, Avista’s actual P/E of 16.99x is below the Fair Ratio of 18.77x, which points to the shares trading at a discount on this metric.
Result: UNDERVALUED
P/E ratios tell one story, but what if the real opportunity lies elsewhere? Start investing in legacies, not executives. Discover our 19 top founder-led companies.
Upgrade Your Decision Making: Choose your Avista Narrative
Earlier we mentioned that there is an even better way to understand valuation. Let us introduce you to Narratives, a simple tool on Simply Wall St's Community page where you connect your view of Avista's story to a set of revenue, earnings and margin forecasts, link those to a fair value, then compare that fair value with the current share price to help decide whether the stock looks attractive or stretched. The narrative automatically updates as new earnings or news arrive. One investor might build a more optimistic Avista narrative closer to US$49.00, while another might prefer a more cautious one nearer to US$36.00, all using the same shared framework.
Do you think there's more to the story for Avista? Head over to our Community to see what others are saying!

This article by Simply Wall St is general in nature. We provide commentary based on historical data and analyst forecasts only using an unbiased methodology and our articles are not intended to be financial advice. It does not constitute a recommendation to buy or sell any stock, and does not take account of your objectives, or your financial situation. We aim to bring you long-term focused analysis driven by fundamental data. Note that our analysis may not factor in the latest price-sensitive company announcements or qualitative material. Simply Wall St has no position in any stocks mentioned.
Have feedback on this article? Concerned about the content? Get in touch with us directly. Alternatively, email editorial-team@simplywallst.com