


- If you are wondering whether Babcock & Wilcox Enterprises at around US$14.90 still offers value or if the opportunity has passed, the key is to look closely at what the current price really implies.
- The stock has recorded a 6.1% return over the past week, 52.8% over the last 30 days and 134.6% year to date, with a very large 1 year return figure that may have shifted how the market views its risk and reward profile.
- Recent headlines have focused on Babcock & Wilcox Enterprises as part of wider discussions around capital goods and energy related infrastructure companies, which has kept attention on its share price moves. This context matters because changing themes around power generation, emissions control or large scale projects can all influence how investors think about what the company is worth today.
- On Simply Wall St's valuation checks, Babcock & Wilcox Enterprises currently scores 4 out of 6. The next step is to look at how different methods assess that valuation and then finish by considering a broader framework that can help you judge whether the share price really matches the story.
Approach 1: Babcock & Wilcox Enterprises Discounted Cash Flow (DCF) Analysis
A Discounted Cash Flow, or DCF, model looks at the cash Babcock & Wilcox Enterprises could generate in the future and discounts those projections back to what they might be worth in $ today.
For Babcock & Wilcox Enterprises, Simply Wall St applies a 2 Stage Free Cash Flow to Equity model. The latest twelve month free cash flow is a loss of about $79.8 million. Analysts provide free cash flow estimates out to 2028, with Simply Wall St extending these into a ten year path that runs from $27.7 million in 2026 up to $265.8 million in 2035, using a mix of analyst inputs and extrapolated growth rates.
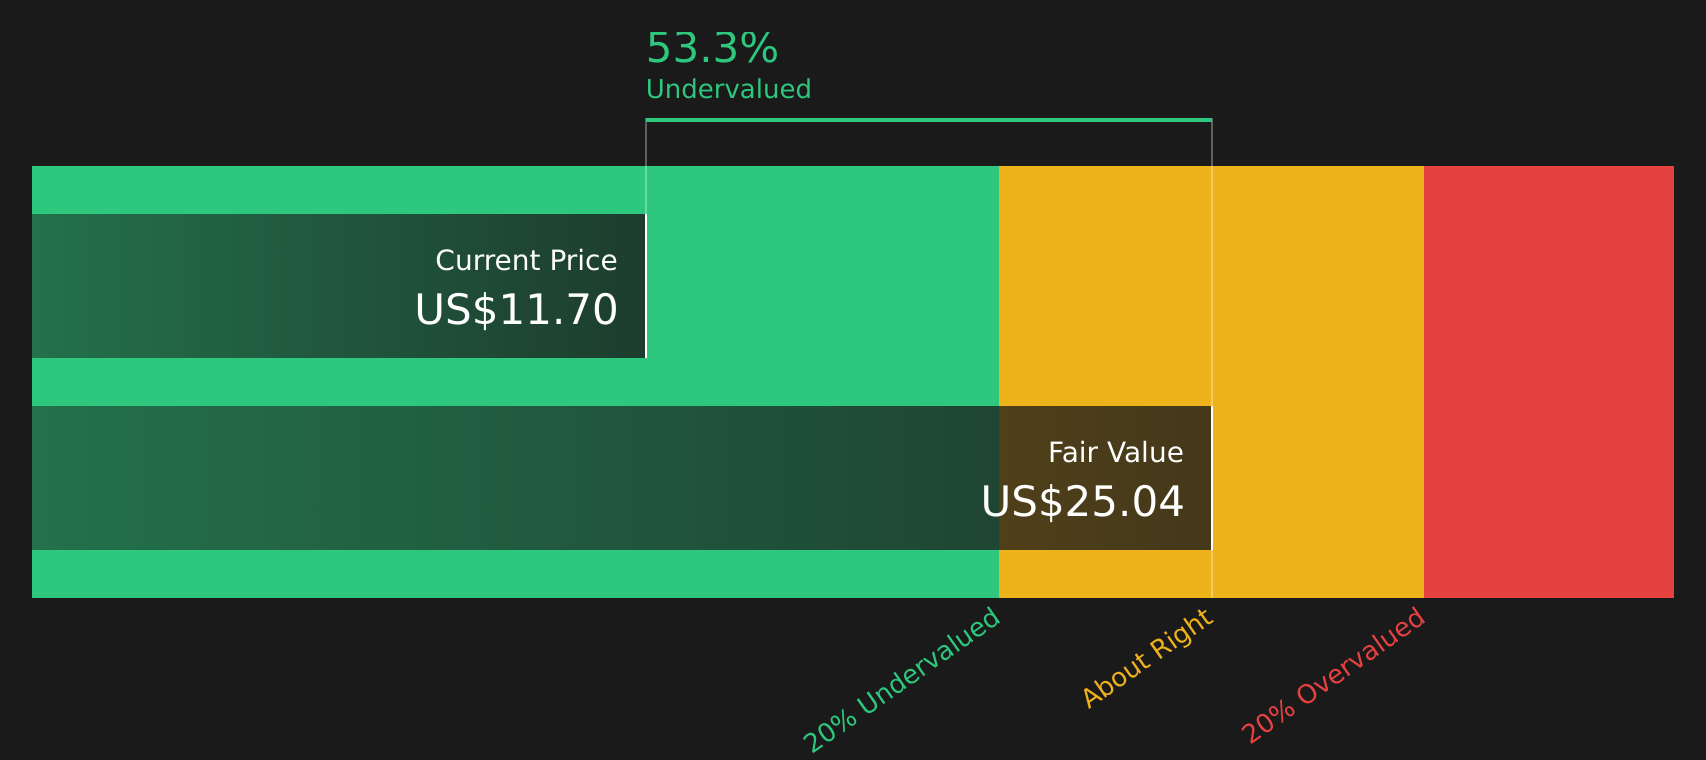
Putting all those projected cash flows together and discounting them back to today gives an estimated intrinsic value of about $18.81 per share. Against a recent share price around $14.90, the model implies the stock trades at roughly a 20.8% discount. This suggests the shares screen as undervalued on this DCF view.
Result: UNDERVALUED
Our Discounted Cash Flow (DCF) analysis suggests Babcock & Wilcox Enterprises is undervalued by 20.8%. Track this in your watchlist or portfolio, or discover 49 more high quality undervalued stocks.
Approach 2: Babcock & Wilcox Enterprises Price vs Sales
For companies where earnings are not a clean guide, the P/S ratio is often a useful cross check as it compares what the market is paying for each dollar of revenue. It still reflects expectations for growth and risk, because investors usually accept a higher or lower P/S depending on how confident they are that sales can be sustained and translated into future profits.
In general, higher expected growth or lower perceived risk can support a higher “normal” P/S, while slower growth or higher risk tends to point to a lower multiple. Babcock & Wilcox Enterprises currently trades on a P/S of 3.31x. That sits above the Electrical industry average of about 2.33x and below the peer group average of 4.58x.
Simply Wall St also calculates a Fair Ratio of 7.93x for Babcock & Wilcox Enterprises on a P/S basis. This proprietary metric estimates what the P/S might be given factors such as the company’s earnings growth profile, profit margins, risks, industry and market cap. Because it is tailored to the company, it can be more informative than a simple comparison against broad industry or peer averages. With the current P/S at 3.31x versus a Fair Ratio of 7.93x, the shares screen on this metric as trading below that Fair Ratio indication.
Result: UNDERVALUED

P/S ratios tell one story, but what if the real opportunity lies elsewhere? Start investing in legacies, not executives. Discover our 20 top founder-led companies.
Upgrade Your Decision Making: Choose your Babcock & Wilcox Enterprises Narrative
Earlier it was mentioned that there is an even better way to understand valuation, so Narratives are introduced here as simple stories you create about Babcock & Wilcox Enterprises that link your view of its future revenue, earnings, margins and fair value to what the share price is doing today.
On Simply Wall St's Community page, Narratives let you connect a clear business story to a set of numbers, then compare the Fair Value that story produces with the current market price to help you decide whether you see the stock as attractively priced or expensive.
Because Narratives update automatically when new earnings, news or other data arrive, your fair value view stays aligned with fresh information rather than a one off spreadsheet.
For Babcock & Wilcox Enterprises, one investor might build a more optimistic Narrative around a Fair Value of US$10.00 that leans on higher revenue growth and a P/E of 37.4x, while another might use a more cautious Fair Value of US$6.00 with slower revenue growth and a P/E of 12.7x. Seeing both side by side can help you judge which story feels closer to your own expectations and what that means for your next move.
Do you think there's more to the story for Babcock & Wilcox Enterprises? Head over to our Community to see what others are saying!

This article by Simply Wall St is general in nature. We provide commentary based on historical data and analyst forecasts only using an unbiased methodology and our articles are not intended to be financial advice. It does not constitute a recommendation to buy or sell any stock, and does not take account of your objectives, or your financial situation. We aim to bring you long-term focused analysis driven by fundamental data. Note that our analysis may not factor in the latest price-sensitive company announcements or qualitative material. Simply Wall St has no position in any stocks mentioned.
Have feedback on this article? Concerned about the content? Get in touch with us directly. Alternatively, email editorial-team@simplywallst.com