


- If you are wondering whether Cognex at around US$49.87 offers fair value or a potential mispricing, it helps to start by lining up the share price against the fundamentals.
- The stock has recently pulled back, with a 2.2% decline over the last 7 days and a 15.2% decline over the last 30 days, even though the return is 35.0% year to date and 61.1% over the past year.
- Recent coverage has focused on Cognex as a key player in machine vision for factory automation, with investors weighing how demand for automation equipment and industrial capital spending affects the business. This context helps explain why sentiment can shift quickly as the market reassesses how much it is willing to pay for future cash flows.
- Cognex currently has a valuation score of 1 out of 6, which suggests only one of the standard undervaluation checks is in its favor. The next step is to compare what different valuation methods say about the stock and then look at an even richer way to think about value at the end of this article.
Cognex scores just 1/6 on our valuation checks. See what other red flags we found in the full valuation breakdown.
Approach 1: Cognex Discounted Cash Flow (DCF) Analysis
A Discounted Cash Flow model estimates what a business could be worth by projecting its future cash flows and then discounting those back to today’s dollars. It is essentially asking what Cognex’s future cash generation might be worth right now.
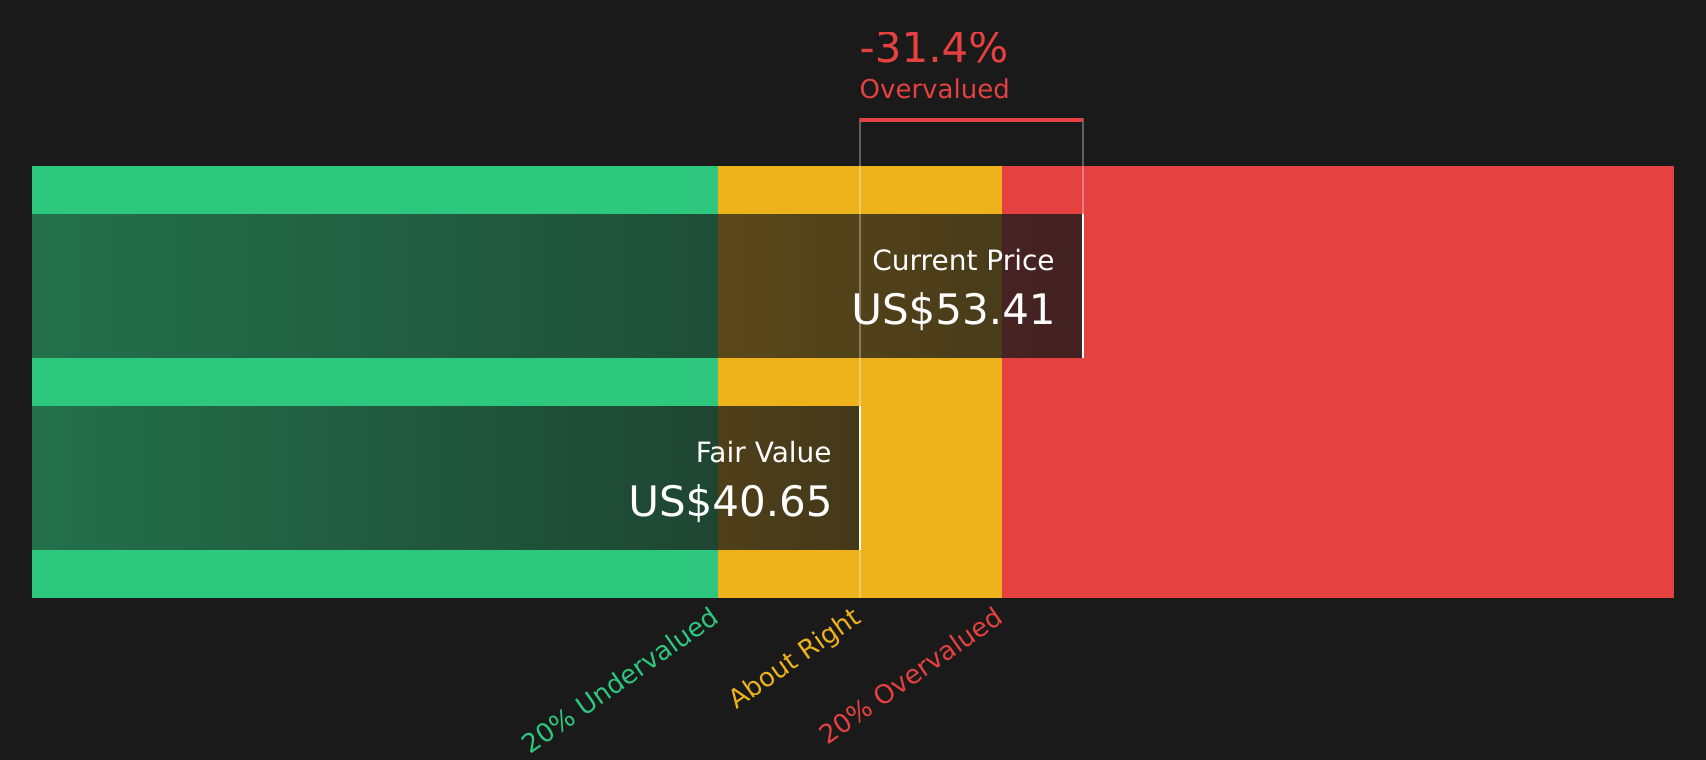
For Cognex, the 2 Stage Free Cash Flow to Equity model starts with last twelve months free cash flow of about $228.5 million. It then uses analyst forecasts and extrapolated estimates to project free cash flow out to 2035. These projections range from $239.1 million in 2026, based on eight analyst inputs, up to $542.7 million in 2035 based on extrapolated growth assumptions. Simply Wall St then discounts each of these projected cash flows back to today using its chosen rate.
On this basis, the model arrives at an estimated intrinsic value of around $46.34 per share. Against the current share price of about $49.87, the DCF output implies Cognex trades at roughly a 7.6% premium to this fair value estimate, which sits well within a reasonable margin of error for this kind of model.
Result: ABOUT RIGHT
Cognex is fairly valued according to our Discounted Cash Flow (DCF), but this can change at a moment's notice. Track the value in your watchlist or portfolio and be alerted on when to act.
Approach 2: Cognex Price vs Earnings
P/E is a common way to value profitable companies because it links what you pay for each share directly to the earnings that support that share. In general, higher expected growth and lower perceived risk can justify a higher P/E, while slower growth or higher risk usually call for a lower, more conservative multiple.
Cognex currently trades on a P/E of about 72.8x. That sits above the Electronic industry average of roughly 28.5x and slightly above the peer average of about 70.7x. This suggests the market is already attaching a premium to its earnings.
Simply Wall St’s Fair Ratio for Cognex is 37.6x. This is a proprietary estimate of what a “normal” P/E could look like for the company after factoring in elements such as earnings growth, profit margins, industry, market cap and specific risks. Because it adjusts for these company level traits, the Fair Ratio aims to give a more tailored anchor than a simple comparison with peers or the broad industry, which may not share the same profile.
Comparing Cognex’s current P/E of 72.8x with the Fair Ratio of 37.6x points to the shares trading at a richer level than this framework would suggest.
Result: OVERVALUED

P/E ratios tell one story, but what if the real opportunity lies elsewhere? Start investing in legacies, not executives. Discover our 20 top founder-led companies.
Upgrade Your Decision Making: Choose your Cognex Narrative
Earlier it was mentioned that there is an even better way to think about value. This is where Narratives come in as a simple way for you to put a clear story behind the numbers, linking what you believe about Cognex’s future revenue, earnings and margins to a specific fair value. You can then compare that to today’s price to decide whether the stock looks attractive, expensive or somewhere in between.
On Simply Wall St’s Community page, Narratives let you set out that story in plain language, tie it to a forecast, and see a live fair value estimate that automatically refreshes when new information such as news, earnings or analyst targets arrives, so your view does not go stale.
For Cognex, one investor might build a Narrative around the higher analyst fair value of US$65.50 with a future P/E of 44.37x. Another might anchor on the more cautious US$52.00 or the bullish US$57.97. By comparing each Narrative fair value with the current share price you can see which story you agree with and how that lines up with your own buy or sell decisions.
Do you think there's more to the story for Cognex? Head over to our Community to see what others are saying!

This article by Simply Wall St is general in nature. We provide commentary based on historical data and analyst forecasts only using an unbiased methodology and our articles are not intended to be financial advice. It does not constitute a recommendation to buy or sell any stock, and does not take account of your objectives, or your financial situation. We aim to bring you long-term focused analysis driven by fundamental data. Note that our analysis may not factor in the latest price-sensitive company announcements or qualitative material. Simply Wall St has no position in any stocks mentioned.
Have feedback on this article? Concerned about the content? Get in touch with us directly. Alternatively, email editorial-team@simplywallst.com