


Why Genesis Energy is on investors’ radar today
Genesis Energy (GEL) has attracted fresh attention after recent trading left the units around $17.54, with the partnership posting a loss of $89.664 million on revenue of $1.63b over its latest reported period.
See our latest analysis for Genesis Energy.
The recent 1 day and 7 day share price pullback sits against a stronger 90 day share price return of 13.09% and a 1 year total shareholder return of 21.62%. This suggests momentum has been building over a longer stretch.
If Genesis Energy’s move has you thinking about what else is working in energy infrastructure, it could be a good moment to check out 25 power grid technology and infrastructure stocks
With units trading near $17.54, a value score of 4 and an intrinsic value estimate suggesting a sizeable discount, the key question is whether Genesis Energy is genuinely undervalued or if the market is already pricing in future growth.
Preferred Price-to-Sales of 1.3x: Is it justified?
On a P/S of 1.3x at a last close of $17.54, Genesis Energy screens as cheaper than peers, yet richer than its own estimated fair P/S level.
The P/S ratio compares the partnership’s market value to its revenue, which can be useful for businesses that are currently loss making, as is the case here. For Genesis Energy, the current 1.3x sits below the US Oil and Gas industry average of 2x and below a broader peer group average of 3.7x, which points to a lower price tag being applied to each dollar of sales.
However, against an estimated fair P/S of 0.9x, the current 1.3x implies investors are paying more than the level suggested by that fair ratio model. That leaves a gap the market could move toward over time, while still leaving Genesis Energy on a cheaper multiple than many peers if industry averages hold.
Explore the SWS fair ratio for Genesis Energy
Result: Price-to-sales of 1.3x (UNDERVALUED versus peers, ABOVE FAIR RATIO LEVEL).
However, there are still clear pressure points, including the recent revenue decline of 0.64% and the loss of $89.664 million, that could challenge any undervaluation case.
Find out about the key risks to this Genesis Energy narrative.
Another view on value
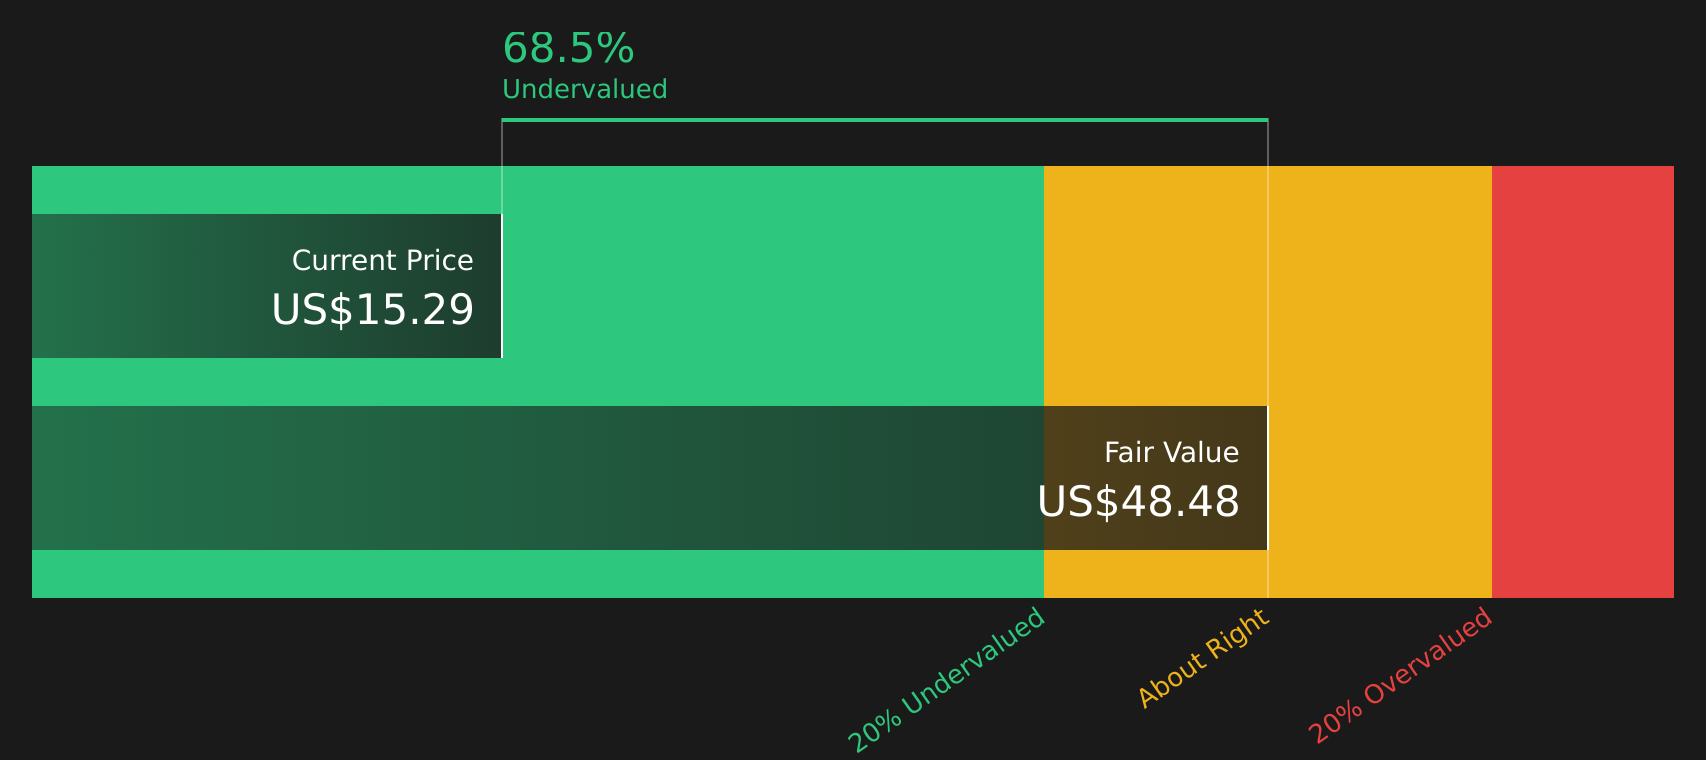
The SWS DCF model points to an estimated future cash flow value of $49.96 per unit, versus the current $17.54 price. That gap suggests the units screen as undervalued on this approach, even though the P/S discussion earlier hinted at a more cautious picture. Which metric should be treated as the better guide?
Look into how the SWS DCF model arrives at its fair value.
Simply Wall St performs a discounted cash flow (DCF) on every stock in the world every day (check out Genesis Energy for example). We show the entire calculation in full. You can track the result in your watchlist or portfolio and be alerted when this changes, or use our stock screener to discover 49 high quality undervalued stocks. If you save a screener we even alert you when new companies match - so you never miss a potential opportunity.
Next Steps
Mixed signals so far, right, with both risks and rewards in play, so move quickly to review the data yourself and see what stands out, then round out your view with the 2 key rewards and 1 important warning sign
Looking for more investment ideas?
If Genesis Energy has sharpened your interest, do not stop here. Broaden your watchlist with other clear, data driven ideas before the next move passes you by.
- Target stability with companies that show financial resilience and lower risk profiles using the 72 resilient stocks with low risk scores.
- Hunt for quality at a reasonable price by scanning for companies that look attractively priced on fundamentals through the 49 high quality undervalued stocks.
- Strengthen your income focus by reviewing candidates with higher yields and resilient payout histories via the 13 dividend fortresses.
This article by Simply Wall St is general in nature. We provide commentary based on historical data and analyst forecasts only using an unbiased methodology and our articles are not intended to be financial advice. It does not constitute a recommendation to buy or sell any stock, and does not take account of your objectives, or your financial situation. We aim to bring you long-term focused analysis driven by fundamental data. Note that our analysis may not factor in the latest price-sensitive company announcements or qualitative material. Simply Wall St has no position in any stocks mentioned.
Have feedback on this article? Concerned about the content? Get in touch with us directly. Alternatively, email editorial-team@simplywallst.com