


- If you are wondering whether SS&C Technologies Holdings is attractively priced or just a value trap, starting with a clear look at its current valuation can help frame that question.
- The stock last closed at US$65.42, with returns of an 8.3% decline over 7 days, 10.2% decline over 30 days, 23.7% decline year to date, 19.2% decline over 1 year, 20.8% gain over 3 years and 1.6% decline over 5 years, which may influence how you think about its risk and return profile.
- Recent coverage around SS&C Technologies Holdings has focused on its role within professional services and how investors are reassessing companies in this space in light of changing expectations. This context helps explain why some shareholders may be rethinking what counts as a fair price for the stock today.
- On Simply Wall St, SS&C Technologies Holdings currently has a valuation score of 4 out of 6, based on how often it screens as undervalued across different checks. The rest of this article will compare those methods and will also point you to an even richer way to think about valuation at the end.
Approach 1: SS&C Technologies Holdings Discounted Cash Flow (DCF) Analysis
A Discounted Cash Flow, or DCF, model estimates what a company might be worth by projecting its future cash flows and discounting them back to today using a required rate of return. It is essentially asking what those future dollars are worth in present terms.
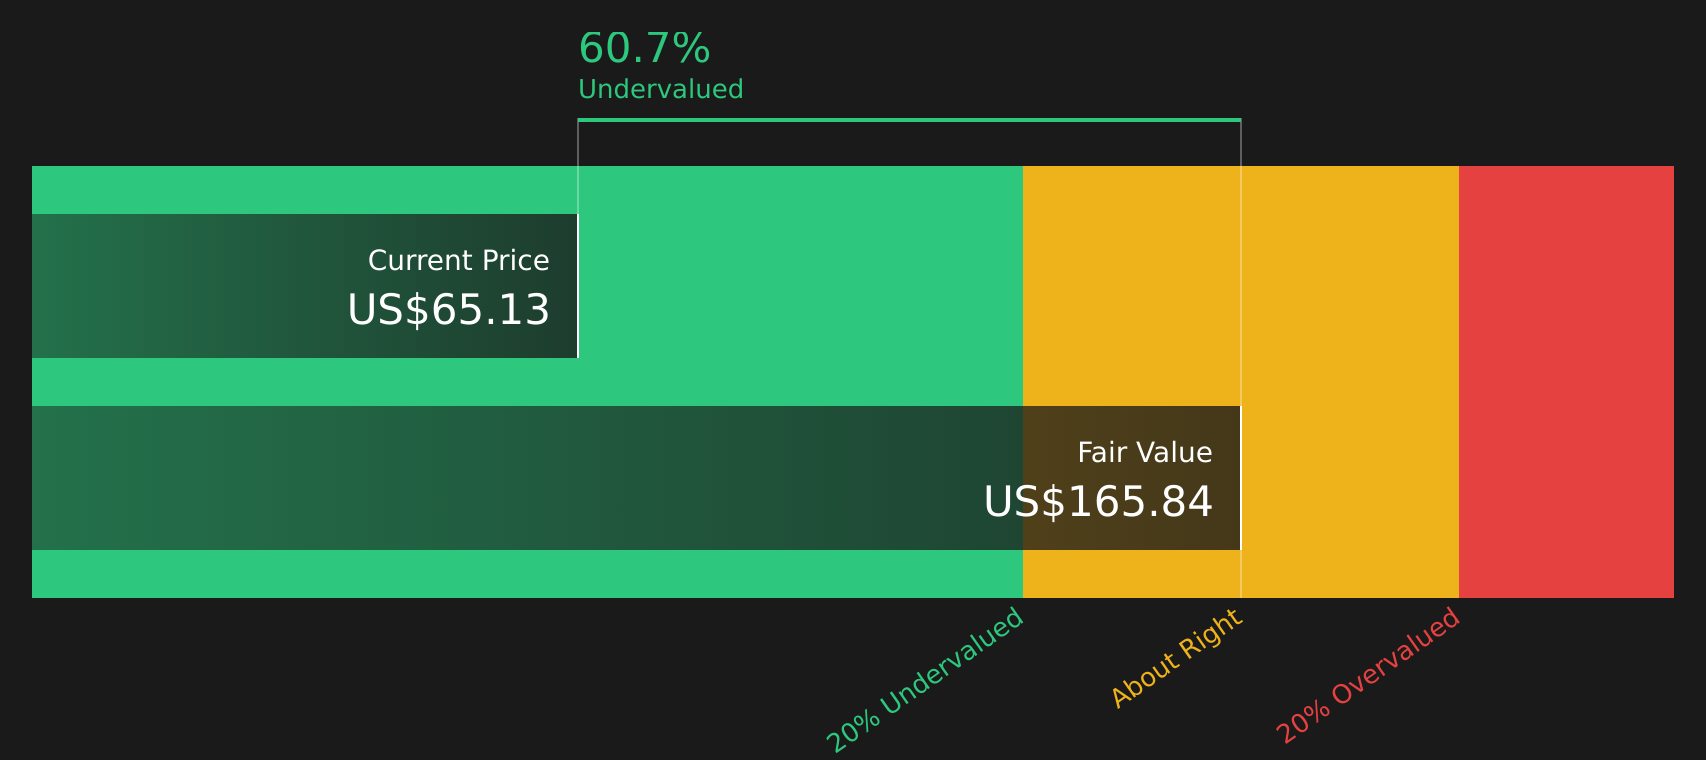
For SS&C Technologies Holdings, the model uses a 2 Stage Free Cash Flow to Equity approach based on cash flow projections. The latest twelve month free cash flow stands at about $1.46b. Analyst inputs and subsequent extrapolations by Simply Wall St project free cash flow reaching around $2.01b by 2030, with interim years such as 2026 and 2027 sitting in the $1.65b to $1.85b range before further estimated growth.
When all those projected cash flows are discounted back, the model arrives at an estimated intrinsic value of about $150.23 per share. Compared with the recent share price of $65.42, this implies an intrinsic discount of roughly 56.5%, which indicates that the stock screens as materially undervalued on this DCF view.
Result: UNDERVALUED
Our Discounted Cash Flow (DCF) analysis suggests SS&C Technologies Holdings is undervalued by 56.5%. Track this in your watchlist or portfolio, or discover 61 more high quality undervalued stocks.
Approach 2: SS&C Technologies Holdings Price vs Earnings
For a profitable company like SS&C Technologies Holdings, the P/E ratio is a useful way to relate what you pay per share to the earnings that each share represents. It helps you quickly see how much investors are currently willing to pay for every dollar of earnings.
What counts as a normal or fair P/E usually depends on how the market views a company’s growth prospects and risk. Higher growth or lower perceived risk can support a higher P/E, while slower growth or higher risk often comes with a lower P/E.
SS&C Technologies Holdings currently trades on a P/E of 19.83x. This sits above both the Professional Services industry average of 18.39x and the peer average of 14.15x, which suggests the market is assigning a higher earnings multiple than many close comparables. Simply Wall St’s Fair Ratio for the stock is 24.85x, which is a proprietary estimate of what the P/E could be given its earnings growth profile, industry, profit margins, market cap and risk factors.
Because the Fair Ratio is tailored to the company’s specifics rather than broad peer groups, it can offer a more company focused view. With a Fair Ratio of 24.85x versus the current 19.83x, SS&C Technologies Holdings screens as undervalued on this P/E basis.
Result: UNDERVALUED

P/E ratios tell one story, but what if the real opportunity lies elsewhere? Start investing in legacies, not executives. Discover our 20 top founder-led companies.
Upgrade Your Decision Making: Choose your SS&C Technologies Holdings Narrative
Earlier it was mentioned that there is an even better way to understand valuation. Narratives on Simply Wall St’s Community page let you turn your view of SS&C Technologies Holdings into a clear story that ties together your assumptions about future revenue, earnings and margins, connects that story to a financial forecast and fair value, and then compares that fair value with the current share price to help you decide whether the stock looks attractive or expensive based on your own expectations. Each Narrative updates automatically when new news, guidance or earnings arrive. For example, one investor might build a bullish SS&C view around a fair value near the most optimistic analyst target of US$110.00, while another might anchor on a more cautious fair value closer to US$88.00, and you can see how those different stories translate into different decisions.
Do you think there's more to the story for SS&C Technologies Holdings? Head over to our Community to see what others are saying!

This article by Simply Wall St is general in nature. We provide commentary based on historical data and analyst forecasts only using an unbiased methodology and our articles are not intended to be financial advice. It does not constitute a recommendation to buy or sell any stock, and does not take account of your objectives, or your financial situation. We aim to bring you long-term focused analysis driven by fundamental data. Note that our analysis may not factor in the latest price-sensitive company announcements or qualitative material. Simply Wall St has no position in any stocks mentioned.
Have feedback on this article? Concerned about the content? Get in touch with us directly. Alternatively, email editorial-team@simplywallst.com