


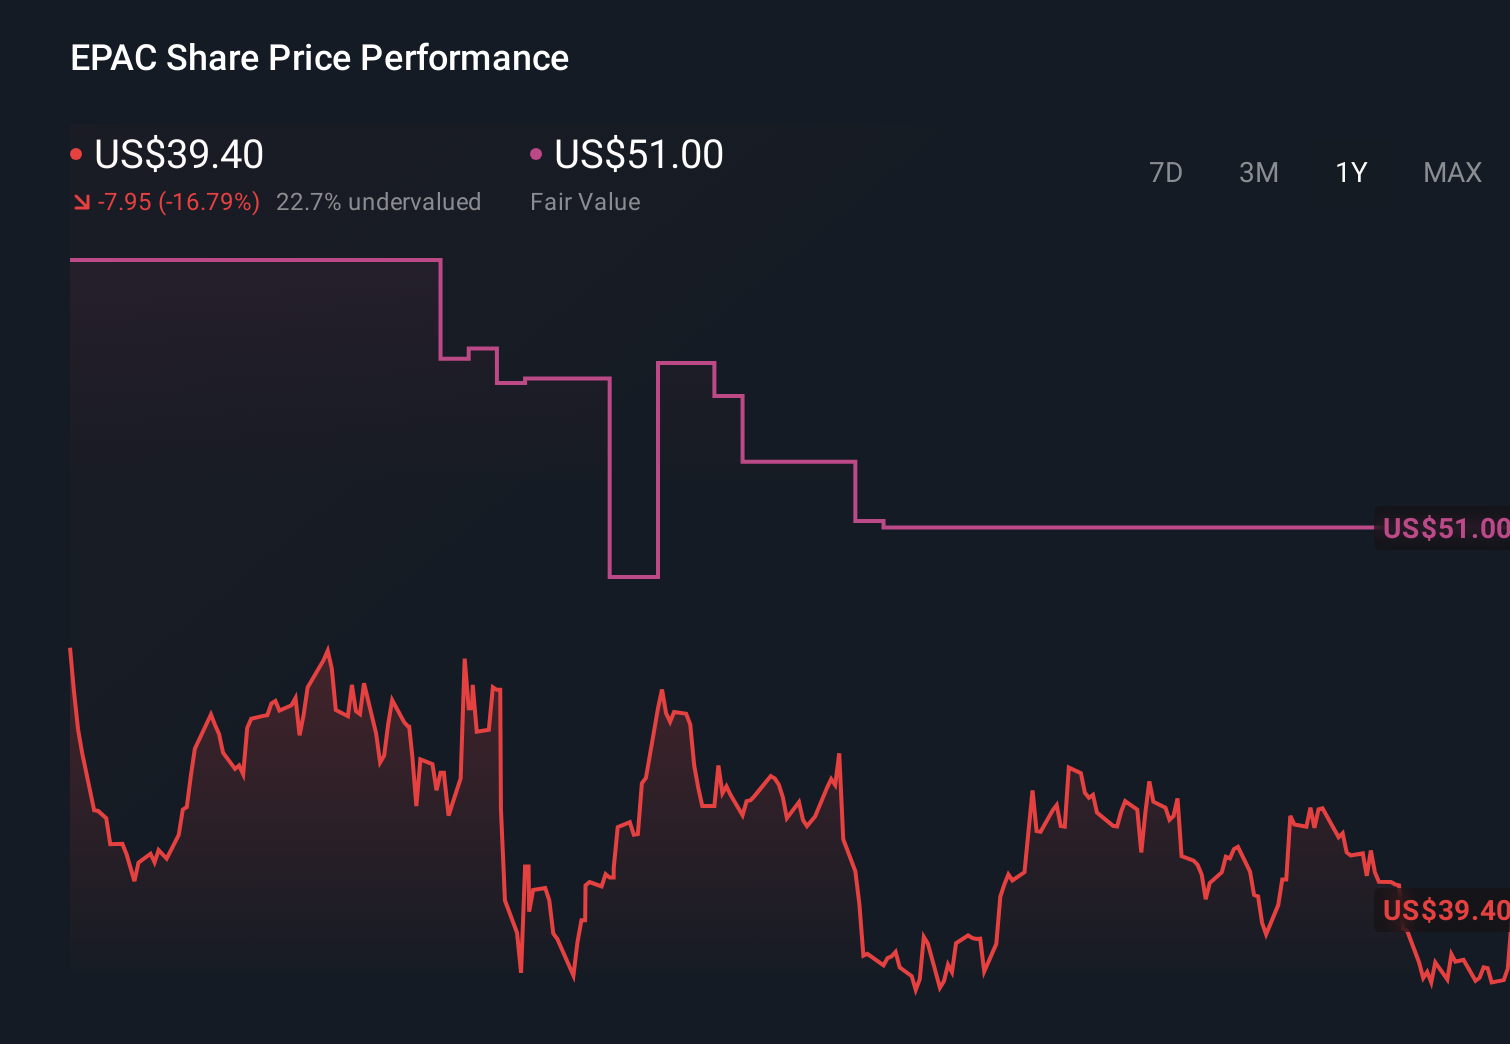
- Enerpac Tool Group Corp. recently reported its second quarter fiscal 2026 results, showing higher sales of US$154.81 million but lower net income of US$16.31 million year over year, updated its full‑year 2026 guidance, and completed a US$65.9 million share repurchase program initiated in October 2025.
- Management also highlighted an active pipeline of potential acquisitions, backed by low leverage of 0.6x and an untapped revolver, signaling that disciplined M&A remains a central element of Enerpac’s capital deployment plans alongside organic investment and buybacks.
- We’ll now examine how Enerpac’s updated 2026 guidance and continued M&A focus may influence its previously framed investment narrative.
Find 62 companies with promising cash flow potential yet trading below their fair value.
Enerpac Tool Group Investment Narrative Recap
To own Enerpac Tool Group, you need to believe it can convert demand from infrastructure and energy transition projects into consistent earnings while managing cost and integration challenges. The latest quarter showed higher sales but lower net income, and the updated 2026 guidance plus active M&A pipeline do not appear to materially change the near term focus on restoring margin momentum, nor the key risk that acquisition execution and integration could weigh on profitability.
The most relevant update here is Enerpac’s full year 2026 guidance for net sales of US$635 million to US$650 million and GAAP operating profit of US$141 million to US$148 million. This anchors expectations around how much room management has to pursue additional deals while still working to offset tariff and margin pressures, which remain central to whether the M&A led growth story can support higher quality earnings over time.
Yet despite management’s confidence in its M&A funnel, investors should be aware that the uneven performance of past deals like DTA could...
Read the full narrative on Enerpac Tool Group (it's free!)
Enerpac Tool Group's narrative projects $711.0 million revenue and $127.9 million earnings by 2028. This requires 5.4% yearly revenue growth and a $39.8 million earnings increase from $88.1 million today.
Uncover how Enerpac Tool Group's forecasts yield a $49.50 fair value, a 41% upside to its current price.
Exploring Other Perspectives
Four fair value estimates from the Simply Wall St Community span roughly US$39 to US$56 per share, underscoring how differently individual investors can view Enerpac’s prospects. You can weigh those views against the company’s ongoing margin pressure and integration risks to judge how much confidence you place in its acquisition led growth ambitions.
Explore 4 other fair value estimates on Enerpac Tool Group - why the stock might be worth as much as 59% more than the current price!
Reach Your Own Conclusion
Disagree with existing narratives? Extraordinary investment returns rarely come from following the herd, so go with your instincts.
- A great starting point for your Enerpac Tool Group research is our analysis highlighting 2 key rewards that could impact your investment decision.
- Our free Enerpac Tool Group research report provides a comprehensive fundamental analysis summarized in a single visual - the Snowflake - making it easy to evaluate Enerpac Tool Group's overall financial health at a glance.
Interested In Other Possibilities?
Right now could be the best entry point. These picks are fresh from our daily scans. Don't delay:
- AI is about to change healthcare. These 34 stocks are working on everything from early diagnostics to drug discovery. The best part - they are all under $10b in market cap - there's still time to get in early.
- Uncover the next big thing with 32 elite penny stocks that balance risk and reward.
- The latest GPUs need a type of rare earth metal called Terbium and there are only 25 companies in the world exploring or producing it. Find the list for free.
This article by Simply Wall St is general in nature. We provide commentary based on historical data and analyst forecasts only using an unbiased methodology and our articles are not intended to be financial advice. It does not constitute a recommendation to buy or sell any stock, and does not take account of your objectives, or your financial situation. We aim to bring you long-term focused analysis driven by fundamental data. Note that our analysis may not factor in the latest price-sensitive company announcements or qualitative material. Simply Wall St has no position in any stocks mentioned.
Have feedback on this article? Concerned about the content? Get in touch with us directly. Alternatively, email editorial-team@simplywallst.com