


- If you are wondering whether Coterra Energy's share price still offers value at around US$35.14, the key is to understand what the current market price implies about the business.
- The stock has returned 0.3% over the last 7 days, 14.9% over 30 days, 32.1% year to date, 25.0% over 1 year, 54.3% over 3 years and 146.6% over 5 years. This naturally raises questions about how much of the story is already reflected in the price.
- Recent coverage around Coterra Energy has focused on its position within the US energy sector and how investors are assessing oil and gas producers in light of commodity price shifts. This context helps explain why the stock has attracted attention as investors reassess risk and potential reward in the sector.
- Coterra Energy currently holds a 4/6 valuation score, which suggests some metrics point to the shares trading below what certain models indicate. The next sections will compare different valuation approaches before finishing with a broader framework to help you judge value with more confidence.
Find out why Coterra Energy's 25.0% return over the last year is lagging behind its peers.
Approach 1: Coterra Energy Discounted Cash Flow (DCF) Analysis
A Discounted Cash Flow model looks at the cash Coterra Energy is expected to generate in the future and discounts those projections back to today, to estimate what the business might be worth now.
Coterra’s latest twelve month free cash flow stands at about $1.58b. Analysts have provided forecasts out to 2030, with free cash flow projections rising to $3.41b by the end of that year, and Simply Wall St extends these estimates further using its own assumptions. For example, the ten year projections include annual free cash flow figures in the $2.56b to $3.91b range, with each year discounted back to a present value under a 2 Stage Free Cash Flow to Equity model.
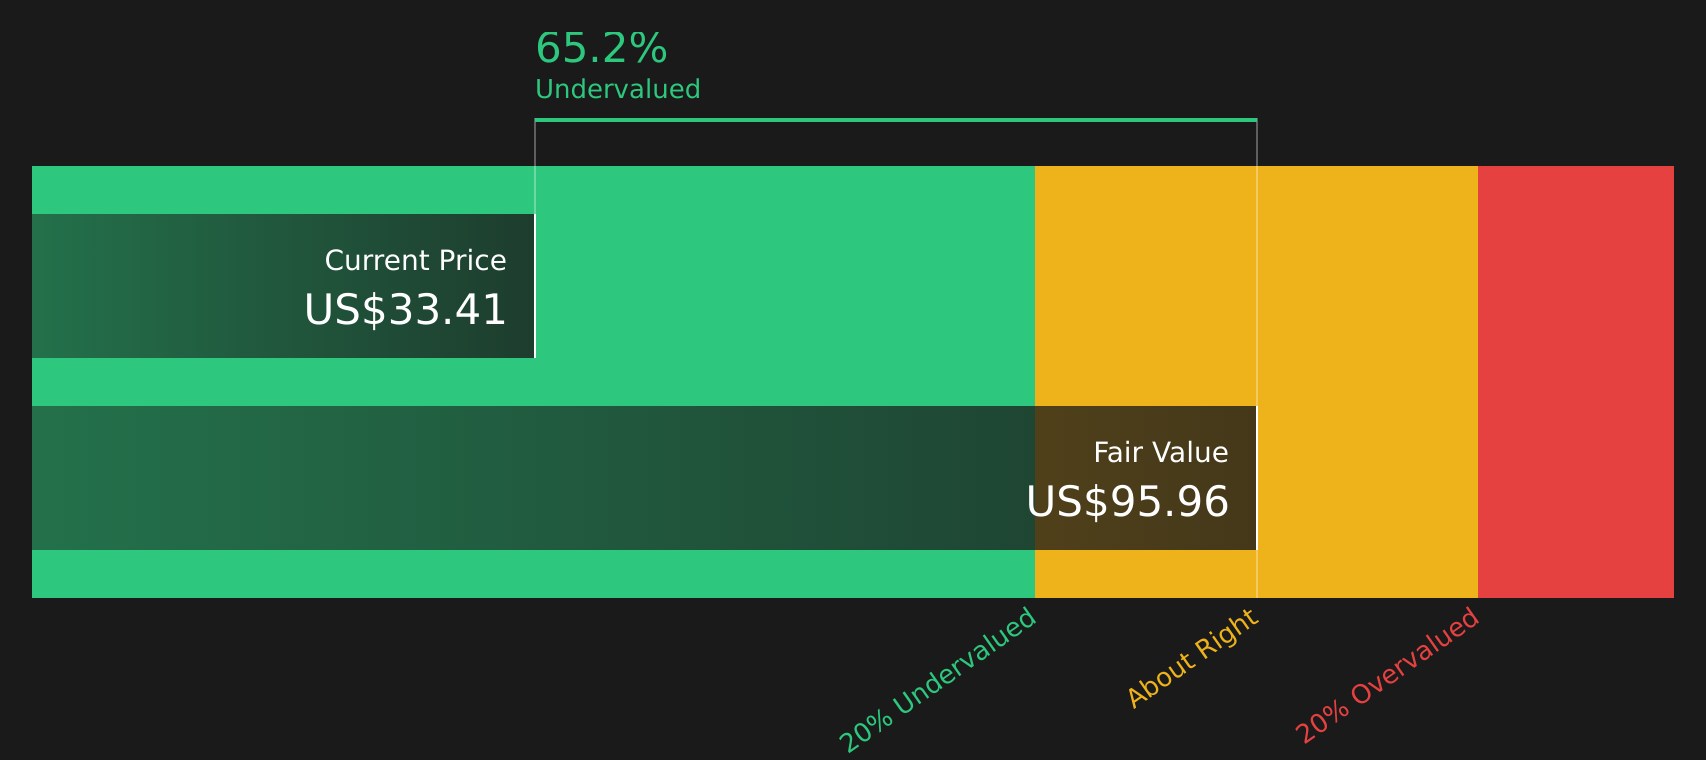
When all those discounted cash flows are added up and divided by the number of shares, the DCF model suggests an estimated intrinsic value of about $106.68 per share. Against a current share price around $35.14, this points to the stock trading at roughly a 67.1% discount, which indicates it screens as materially undervalued on this method alone.
Result: UNDERVALUED
Our Discounted Cash Flow (DCF) analysis suggests Coterra Energy is undervalued by 67.1%. Track this in your watchlist or portfolio, or discover 58 more high quality undervalued stocks.
Approach 2: Coterra Energy Price vs Earnings
For profitable companies like Coterra Energy, the P/E ratio is a straightforward way to link what you pay per share to the earnings the business is generating. It gives you a quick sense of how many dollars investors are willing to pay today for each dollar of current earnings.
What counts as a “normal” or “fair” P/E depends on how the market views a company’s growth prospects and risks. Higher expected growth or lower perceived risk can justify a higher P/E, while lower growth or higher risk usually points to a lower multiple.
Coterra Energy currently trades on a P/E of 15.55x, compared with the Oil and Gas industry average of 16.33x and a peer average of 14.85x. Simply Wall St’s Fair Ratio for Coterra sits higher at 21.53x. This Fair Ratio is a proprietary estimate of what the P/E might be given factors such as earnings growth, profit margins, industry, market cap and company specific risks. Because it blends these inputs, it can offer a more tailored benchmark than a simple comparison with peers or the wider industry.
Set against this Fair Ratio, Coterra’s current 15.55x P/E screens as materially lower, which points to the shares looking inexpensive on this method.
Result: UNDERVALUED

P/E ratios tell one story, but what if the real opportunity lies elsewhere? Start investing in legacies, not executives. Discover our 20 top founder-led companies.
Upgrade Your Decision Making: Choose your Coterra Energy Narrative
Earlier it was mentioned that there is an even better way to understand valuation. Meet Narratives, where you set out a clear story about Coterra Energy, link that story to specific forecasts for revenue, earnings and margins, and see the fair value that drops out of those assumptions.
On Simply Wall St’s Community page, Narratives let you connect the dots from business drivers to numbers to value in a very direct way. They also update automatically when fresh information such as news or earnings is released.
You can then line up each Narrative’s Fair Value against Coterra’s current share price to help decide whether the story you believe in makes the stock look expensive or inexpensive for you, without relying on a single headline target.
For example, one Coterra Energy Narrative on the platform currently points to a Fair Value of about US$25.55 per share. Another sits near the bearish analyst cohort on US$28.00. Others cluster around the analyst consensus at roughly US$35.17, and a more optimistic one reaches about US$42.56. By comparing these side by side you can quickly see how different views on LNG contracts, cost efficiency and long term margins translate into very different conclusions about value.
For Coterra Energy however we will make it really easy for you with previews of two leading Coterra Energy Narratives:
Fair value: US$35.17
Gap to current price: about 0.1% below this narrative fair value, so very close to in line
Revenue growth assumption: 9.46% a year
- Analysts describe Coterra’s revenue growth as being driven by a mix of production across the Permian, Marcellus and Anadarko, supported by technology, LNG links and power market demand for gas.
- They describe earnings reaching about US$1.9b by 2029 with profit margins near 20.9%, supported by cost efficiency and a focus on free cash flow and shareholder returns.
- This view also mentions risks around gas price weakness, operational issues in certain fields, regulatory costs and future Tier 1 inventory depth, which could pressure margins if not managed well.
Fair value: US$25.55
Gap to current price: about 37.5% above this narrative fair value
Revenue growth assumption: 12% a year
- This narrative highlights LNG agreements and projects like Windham Row as key supports for oil and gas volumes, with attention on how they may feed into earnings over time.
- It is based on the view that revenue and earnings can improve with better capital efficiency and high margin assets, while also suggesting that the current share price already reflects a large part of that progress.
- Risks are described as relating to LNG demand and pricing, regulation in regions such as New Mexico, and policy or geopolitical changes that could affect export routes and relative valuation against peers.
If you want to see how these narratives compare and what other investors are assuming for margins, LNG contracts and the Devon merger, the full narrative set on Simply Wall St lets you review them side by side and consider which story feels closest to your own view.
Do you think there's more to the story for Coterra Energy? Head over to our Community to see what others are saying!

This article by Simply Wall St is general in nature. We provide commentary based on historical data and analyst forecasts only using an unbiased methodology and our articles are not intended to be financial advice. It does not constitute a recommendation to buy or sell any stock, and does not take account of your objectives, or your financial situation. We aim to bring you long-term focused analysis driven by fundamental data. Note that our analysis may not factor in the latest price-sensitive company announcements or qualitative material. Simply Wall St has no position in any stocks mentioned.
Have feedback on this article? Concerned about the content? Get in touch with us directly. Alternatively, email editorial-team@simplywallst.com