


- In March 2026, EMCOR Group, Inc. was added to the FTSE All-World Index (USD), reflecting its growing relevance in global equity benchmarks.
- This index inclusion comes as EMCOR reports strong market share gains, higher returns on capital, and earnings per share growth outpacing its already solid revenue expansion.
- Next, we’ll examine how heightened investor interest ahead of EMCOR’s upcoming earnings report could influence the company’s investment narrative.
We've uncovered the 12 dividend fortresses yielding 5%+ that don't just survive market storms, but thrive in them.
EMCOR Group Investment Narrative Recap
To own EMCOR, you need to believe it can keep converting its electrical, mechanical, and facilities expertise into resilient cash flows despite cyclical project demand, labor constraints, and integration risks from acquisitions. Its addition to the FTSE All-World Index may support near-term liquidity and visibility, but it does not fundamentally change the near-term earnings risk if project volumes in key end markets slow or wage pressures persist.
The FTSE All-World inclusion sits alongside EMCOR’s recently reaffirmed 2026 guidance for US$17.75 billion to US$18.50 billion in revenue and diluted EPS of US$27.25 to US$29.25. That guidance, together with ongoing buybacks and EPS growth outpacing revenue, is more directly tied to the stock’s main catalyst around upcoming earnings than the index change itself, even as index status potentially amplifies any reaction to those results.
Yet behind this strong recent run, investors should be aware of how exposed EMCOR remains to cyclical project volumes and...
Read the full narrative on EMCOR Group (it's free!)
EMCOR Group's narrative projects $20.9 billion revenue and $1.6 billion earnings by 2029. This requires 7.2% yearly revenue growth and roughly a $0.3 billion earnings increase from $1.3 billion today.
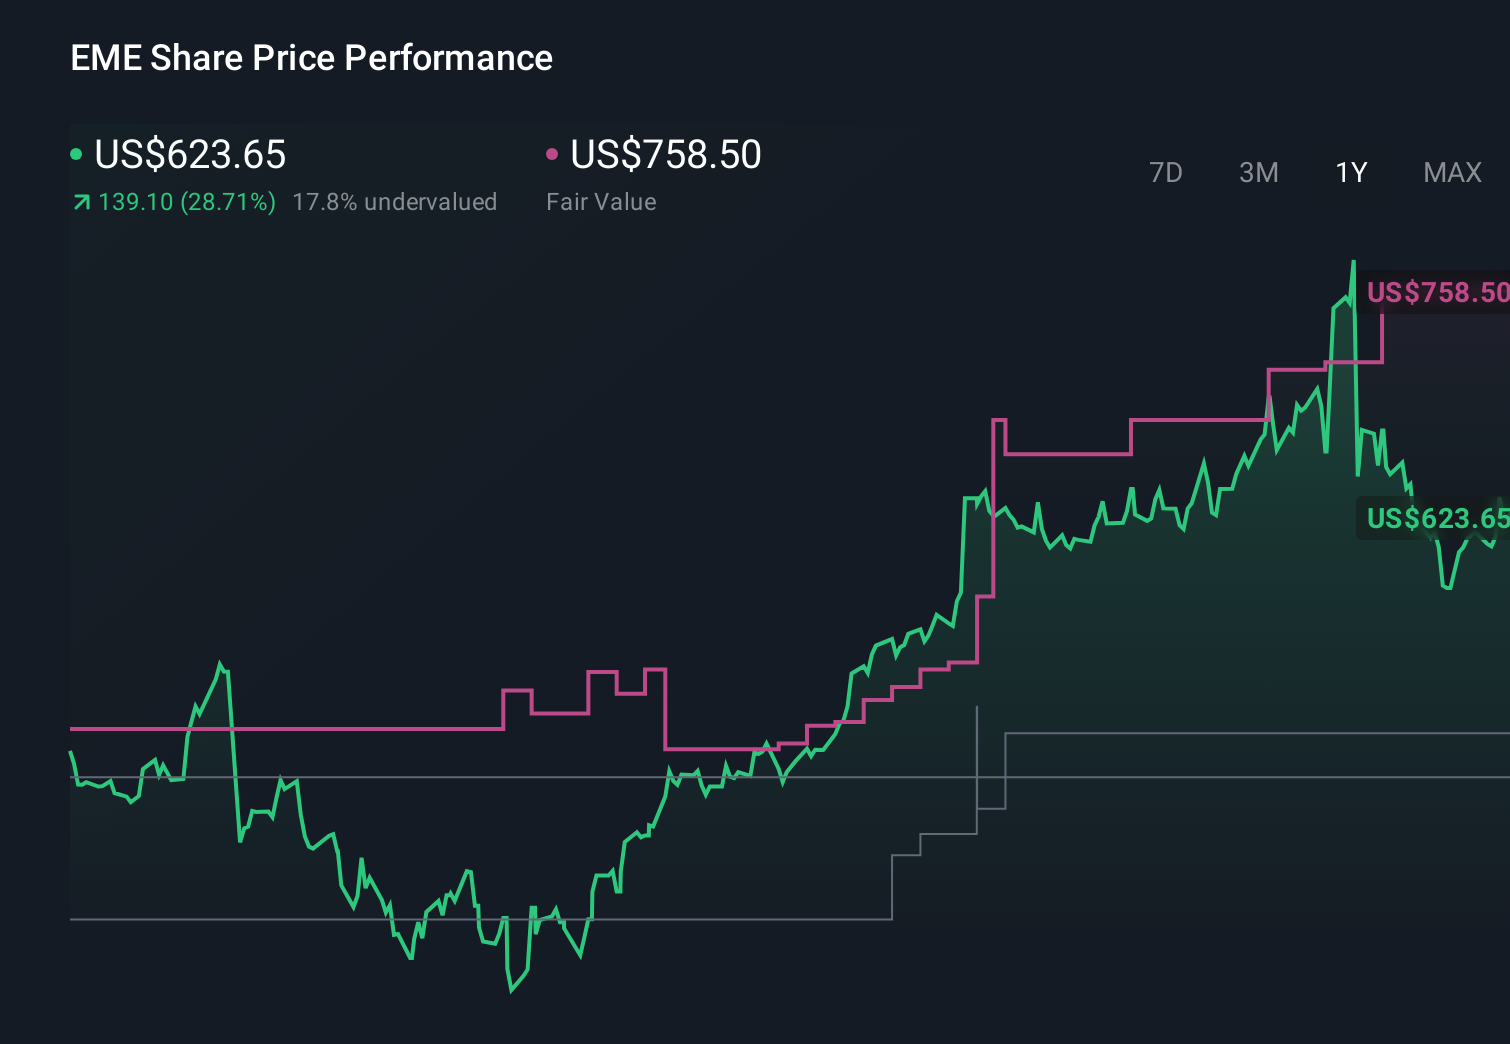
Uncover how EMCOR Group's forecasts yield a $869.29 fair value, a 18% upside to its current price.
Exploring Other Perspectives
While consensus focuses on steady growth and recent index inclusion, the most optimistic analysts see EMCOR reaching about US$21.2 billion in revenue and US$1.4 billion in earnings by 2028, which is a far more bullish view on its ability to turn current project momentum into durable profitability.
Explore 7 other fair value estimates on EMCOR Group - why the stock might be worth 26% less than the current price!
Reach Your Own Conclusion
Don't just follow the ticker - dig into the data and build a conviction that's truly your own.
- A great starting point for your EMCOR Group research is our analysis highlighting 4 key rewards and 1 important warning sign that could impact your investment decision.
- Our free EMCOR Group research report provides a comprehensive fundamental analysis summarized in a single visual - the Snowflake - making it easy to evaluate EMCOR Group's overall financial health at a glance.
Ready To Venture Into Other Investment Styles?
Our daily scans reveal stocks with breakout potential. Don't miss this chance:
- Uncover the next big thing with 31 elite penny stocks that balance risk and reward.
- Invest in the nuclear renaissance through our list of 94 elite nuclear energy infrastructure plays powering the global AI revolution.
- Capitalize on the AI infrastructure supercycle with our selection of the 36 best 'picks and shovels' of the AI gold rush converting record-breaking demand into massive cash flow.
This article by Simply Wall St is general in nature. We provide commentary based on historical data and analyst forecasts only using an unbiased methodology and our articles are not intended to be financial advice. It does not constitute a recommendation to buy or sell any stock, and does not take account of your objectives, or your financial situation. We aim to bring you long-term focused analysis driven by fundamental data. Note that our analysis may not factor in the latest price-sensitive company announcements or qualitative material. Simply Wall St has no position in any stocks mentioned.
Have feedback on this article? Concerned about the content? Get in touch with us directly. Alternatively, email editorial-team@simplywallst.com