


- If you are wondering whether Kosmos Energy's share price still reflects its underlying worth, the recent moves in the stock make that question especially timely.
- The stock last closed at US$2.78, with returns of 2.2% over 7 days, 19.3% over 30 days, 211.4% year to date and 23.6% over 1 year, set against a 64.3% decline over 3 years and a 9.2% decline over 5 years.
- Recent news coverage has focused on Kosmos Energy's positioning within the energy sector and how investors are reacting to changes in its operating backdrop and financing conditions. Headlines have also highlighted how sentiment has shifted as the share price has moved away from its multi year lows, which gives fresh context to the latest performance figures.
- Kosmos Energy currently holds a valuation score of 4 out of 6. This reflects how many of Simply Wall St's checks currently suggest the stock may be undervalued. The next sections will compare different valuation methods to that score and finish with a broader way to think about what valuation really means for you.
Find out why Kosmos Energy's 23.6% return over the last year is lagging behind its peers.
Approach 1: Kosmos Energy Discounted Cash Flow (DCF) Analysis
A Discounted Cash Flow, or DCF, model estimates what a company might be worth by projecting its future cash flows and discounting them back to today using a required rate of return. It is essentially a way of saying: what is all that future cash worth in today's dollars.
For Kosmos Energy, the DCF used here is a 2 stage Free Cash Flow to Equity model that looks at free cash flow available to shareholders. The latest twelve month free cash flow is a loss of about $468.5 million. Analysts provide explicit forecasts for several years, and Simply Wall St extends those with its own assumptions. In this model, projected free cash flow for 2030 is $501 million, with annual figures between 2026 and 2035 ranging from about $203 million to $536 million before discounting, all in $.
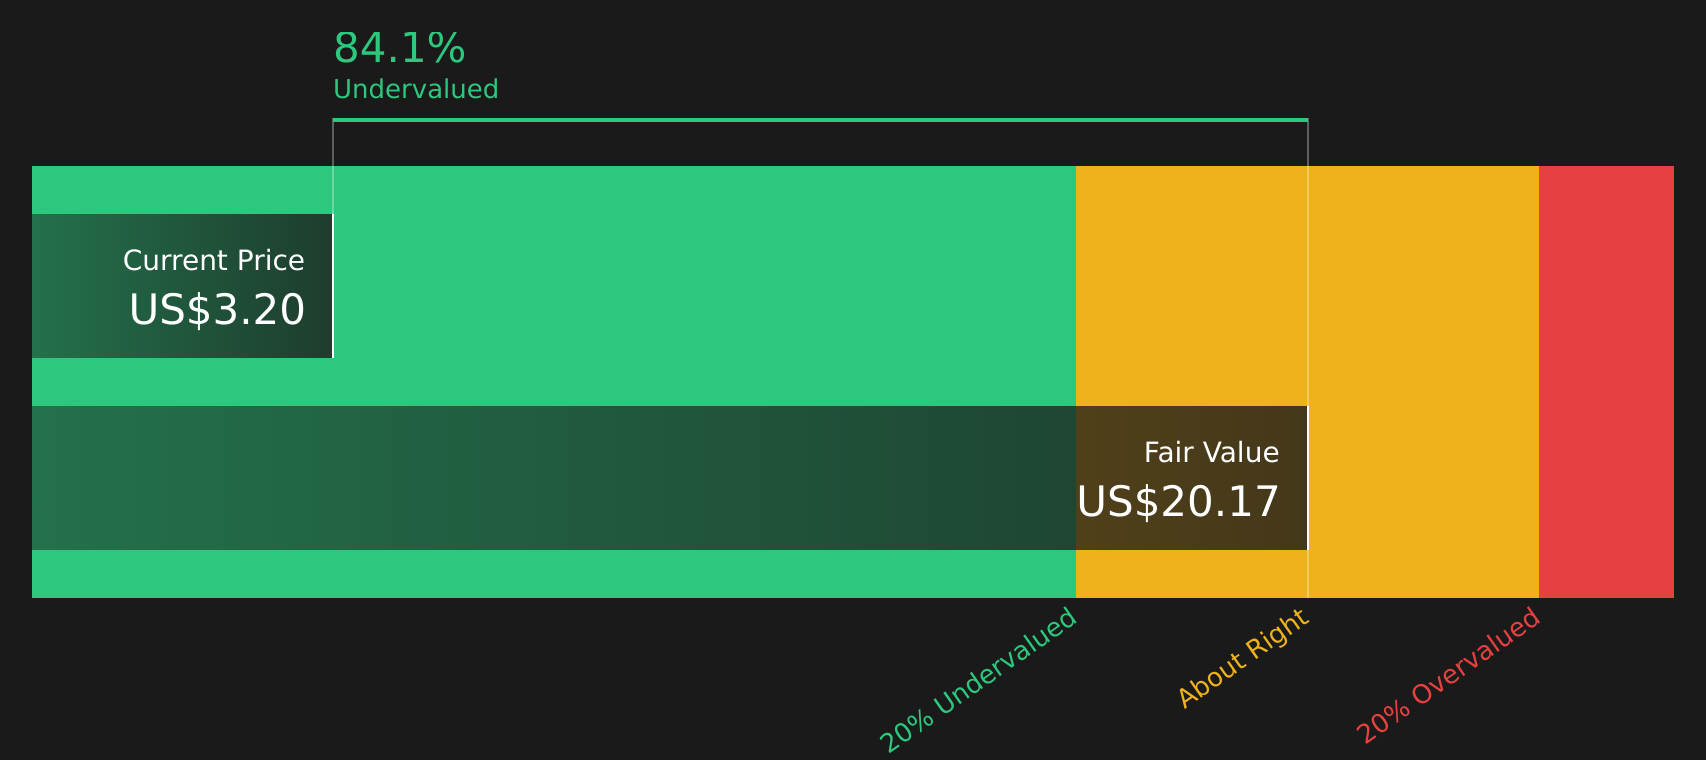
Based on these cash flow projections, the model arrives at an estimated intrinsic value of about $11.99 per share for Kosmos Energy, versus a recent market price of $2.78. That gap implies the shares are trading at a 76.8% discount to this DCF estimate, which is a wide margin.
Result: UNDERVALUED
Our Discounted Cash Flow (DCF) analysis suggests Kosmos Energy is undervalued by 76.8%. Track this in your watchlist or portfolio, or discover 58 more high quality undervalued stocks.
Approach 2: Kosmos Energy Price vs Sales
For companies where earnings can swing around, the P/S ratio is often a useful way to compare what investors are paying for each dollar of revenue. It sidesteps short term profit volatility and focuses on how the market values the core business activity, which is especially relevant for energy companies with large investment cycles.
What counts as a “normal” P/S ratio usually reflects what investors expect for future growth and how much risk they see in the business. Higher expected growth and lower perceived risk tend to support higher multiples, while lower growth and higher risk usually point to lower ones.
Kosmos Energy currently trades on a P/S of 1.28x. This sits below the Oil and Gas industry average P/S of 2.15x and also below the peer group average of 7.03x. Simply Wall St’s Fair Ratio for Kosmos Energy is 1.21x. This Fair Ratio is a proprietary estimate of what P/S might be reasonable given factors such as earnings growth, profit margins, industry, market cap and company specific risks. This makes it more tailored than a simple comparison with peers or the broad industry. Since the actual P/S of 1.28x is close to the Fair Ratio of 1.21x, the stock screens as about fairly valued on this metric.
Result: ABOUT RIGHT

P/S ratios tell one story, but what if the real opportunity lies elsewhere? Start investing in legacies, not executives. Discover our 20 top founder-led companies.
Upgrade Your Decision Making: Choose your Kosmos Energy Narrative
Earlier it was mentioned that there is an even better way to understand valuation. Narratives bring your view of Kosmos Energy together in one place by connecting a simple story about the business to a set of revenue, earnings and margin assumptions, then turning that into a Fair Value you can compare with the current share price.
On Simply Wall St’s Community page, Narratives are an easy tool used by millions of investors. You can pick or adjust a view that fits how you see Kosmos, whether that is closer to the more upbeat assumptions that support Fair Values around US$3.50 to US$6.86 or the more cautious views nearer US$2.00, and then see how that stacks up against the latest market price.
Because Narratives are refreshed when new information arrives, such as updated production guidance, equity raises or impairment charges, you can quickly see how the implied Fair Value for Kosmos Energy moves and use that as one input when deciding whether the current price looks rich or conservative relative to the story you believe is most realistic.
For Kosmos Energy however we'll make it really easy for you with previews of two leading Kosmos Energy Narratives:
Fair value in this upbeat narrative: US$3.50 per share.
At a last close of US$2.78, that implies the shares screen as about 20.6% below this fair value anchor, using the relationship between price and the narrative fair value.
Revenue growth assumption: 6.84% a year.
- Assumes future production guidance and project execution support higher free cash flow and wider margins than consensus currently reflects.
- Builds in a view that Kosmos benefits from Atlantic energy demand, reserve upgrades and technology adoption across its portfolio.
- Still flags meaningful risks around the energy transition, asset concentration, financing conditions and regulatory pressure.
Fair value in this more cautious narrative: US$2.51 per share.
At a last close of US$2.78, that suggests the shares sit about 10.8% above this fair value anchor, which frames the current price as richer than this scenario assumes.
Revenue growth assumption: 5.78% a year.
- Builds in steady LNG and oil output with cost control, but pairs that with ongoing equity issuance and the potential for further impairment charges.
- Emphasizes exposure to political and regulatory risks in key producing regions, along with the effect of a sizeable debt load on flexibility.
- Assumes the energy transition, tighter ESG constraints and higher compliance costs could weigh on long term profitability and valuation multiples.
Bringing these together, you have one narrative that anchors closer to higher analyst targets and another that sits nearer the lower end of the range. This gives you a structured way to test your own expectations for volumes, margins and balance sheet risk against where Kosmos Energy trades today.
Do you think there's more to the story for Kosmos Energy? Head over to our Community to see what others are saying!

This article by Simply Wall St is general in nature. We provide commentary based on historical data and analyst forecasts only using an unbiased methodology and our articles are not intended to be financial advice. It does not constitute a recommendation to buy or sell any stock, and does not take account of your objectives, or your financial situation. We aim to bring you long-term focused analysis driven by fundamental data. Note that our analysis may not factor in the latest price-sensitive company announcements or qualitative material. Simply Wall St has no position in any stocks mentioned.
Have feedback on this article? Concerned about the content? Get in touch with us directly. Alternatively, email editorial-team@simplywallst.com