


Over the last 7 days, the United States market has remained flat, yet it is up 16% over the past year with earnings forecast to grow by 15% annually. For investors willing to explore beyond well-known stocks, penny stocks can offer intriguing opportunities that align with current market conditions. Although the term 'penny stocks' may seem outdated, they continue to represent a viable investment area for those seeking affordability and growth potential in smaller or newer companies.
Top 10 Penny Stocks In The United States
| Name | Share Price | Market Cap | Rewards & Risks |
| ATRenew (RERE) | $4.68 | $1.05B | ✅ 4 ⚠️ 0 View Analysis > |
| LexinFintech Holdings (LX) | $2.14 | $366.81M | ✅ 3 ⚠️ 2 View Analysis > |
| Tuya (TUYA) | $2.34 | $1.4B | ✅ 5 ⚠️ 1 View Analysis > |
| FinVolution Group (FINV) | $4.89 | $1.21B | ✅ 4 ⚠️ 1 View Analysis > |
| Tuniu (TOUR) | $0.7625 | $89.34M | ✅ 2 ⚠️ 2 View Analysis > |
| Information Services Group (III) | $3.11 | $183.07M | ✅ 3 ⚠️ 1 View Analysis > |
| Golden Growers Cooperative (GGRO.U) | $5.00 | $77.45M | ✅ 2 ⚠️ 5 View Analysis > |
| Niagen Bioscience (NAGE) | $4.52 | $353.89M | ✅ 3 ⚠️ 1 View Analysis > |
| Cricut (CRCT) | $3.90 | $792.06M | ✅ 2 ⚠️ 2 View Analysis > |
| LifeVantage (LFVN) | $4.20 | $55.32M | ✅ 4 ⚠️ 3 View Analysis > |
Click here to see the full list of 355 stocks from our US Penny Stocks screener.
Let's take a closer look at a couple of our picks from the screened companies.
Real Brokerage (REAX)
Simply Wall St Financial Health Rating: ★★★★★★
Overview: The Real Brokerage Inc. operates as a real estate technology company in the United States and Canada, with a market cap of $530.82 million.
Operations: The company's revenue is primarily derived from its North American Brokerage segment at $1.96 billion, complemented by One Real Mortgage at $6.01 million and One Real Title at $5.04 million.
Market Cap: $530.82M
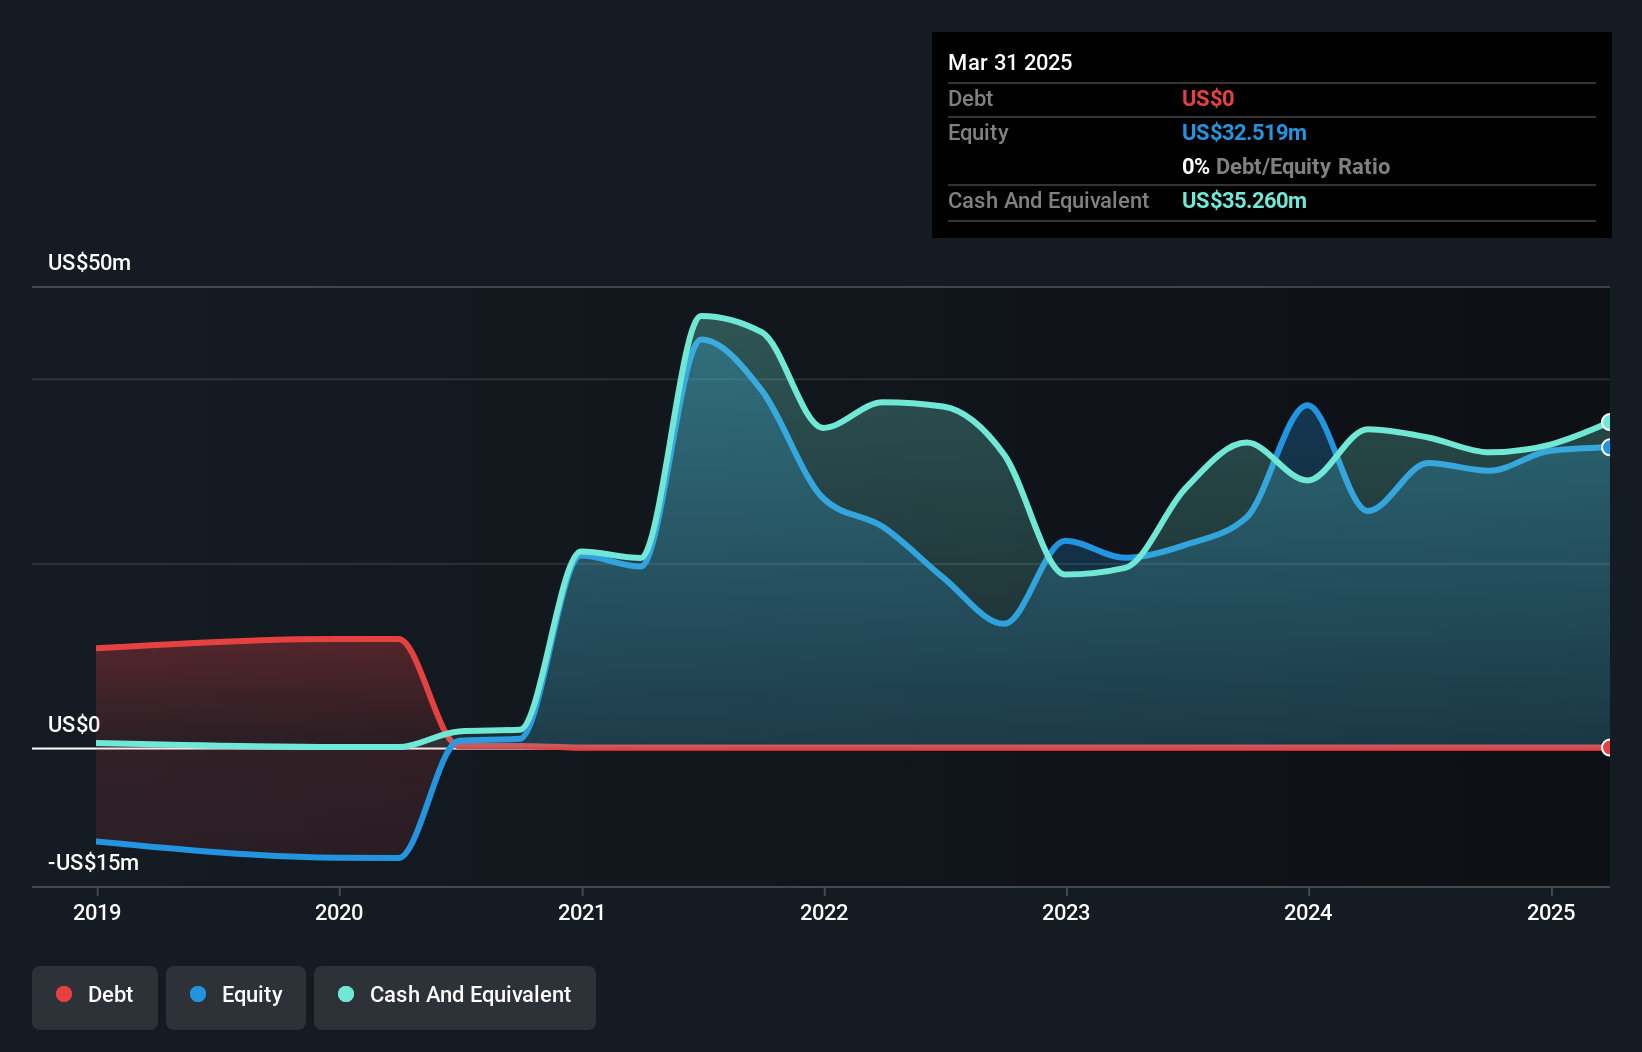
Real Brokerage Inc. has demonstrated significant revenue growth, with sales reaching US$1.97 billion in 2025, though it remains unprofitable with a net loss of US$8.11 million for the year. Despite this, Real is debt-free and maintains a strong cash position, ensuring more than three years of runway based on positive free cash flow growth. Recent strategic moves include the addition of Legends Real Estate Group and key executive appointments aimed at accelerating growth and expanding market presence. The company also completed a share buyback program worth US$15.1 million to enhance shareholder value.
- Navigate through the intricacies of Real Brokerage with our comprehensive balance sheet health report here.
- Gain insights into Real Brokerage's outlook and expected performance with our report on the company's earnings estimates.
Taboola.com (TBLA)
Simply Wall St Financial Health Rating: ★★★★★☆
Overview: Taboola.com Ltd. operates an artificial intelligence-based algorithmic engine platform across various countries, including Israel, the United States, the United Kingdom, and Germany, with a market cap of approximately $860.56 million.
Operations: The company generates its revenue primarily from advertising, amounting to $1.91 billion.
Market Cap: $860.56M
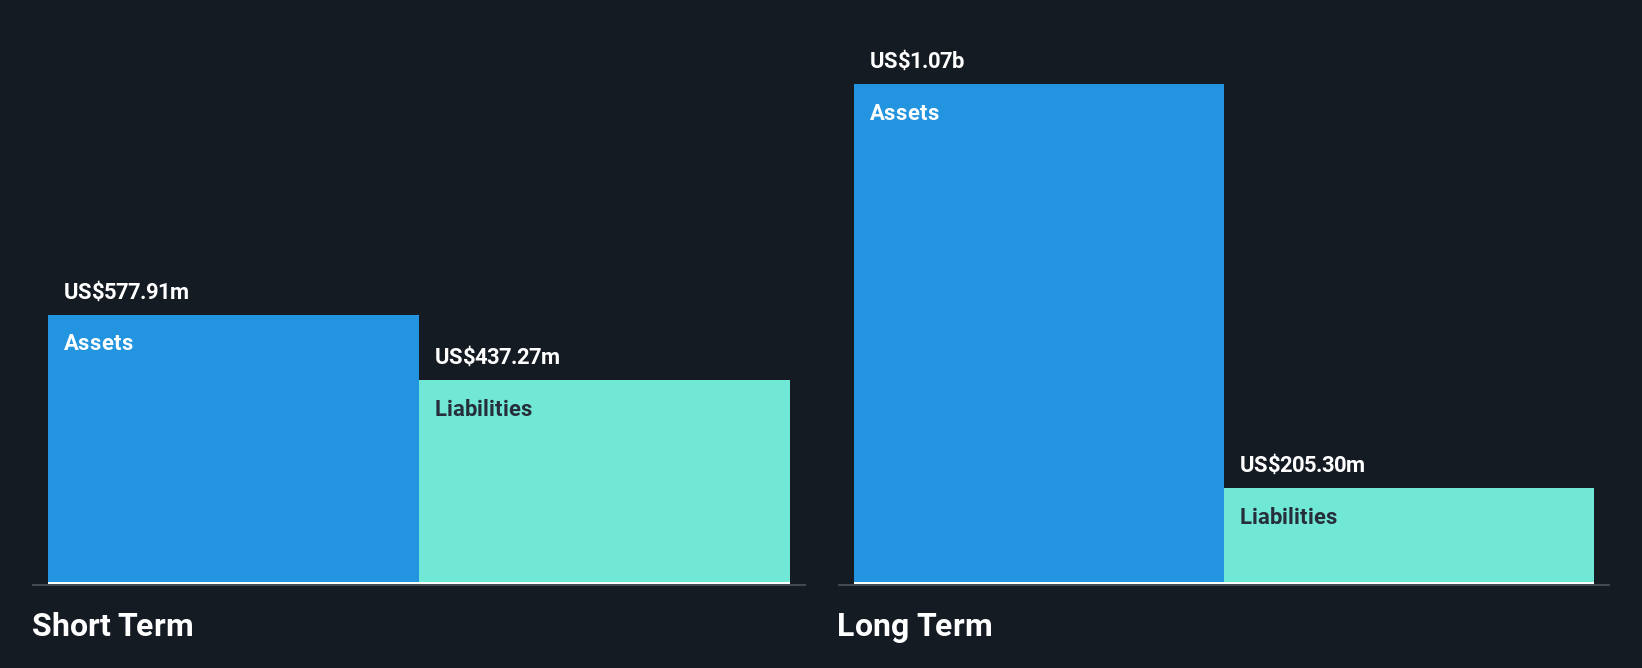
Taboola.com Ltd. has shown a solid financial performance with revenue of US$1.91 billion and net income of US$42.28 million for 2025, marking a turnaround from the previous year's loss. The company maintains strong liquidity, with short-term assets exceeding both short and long-term liabilities, and its debt is well covered by operating cash flow. Recent developments include strategic leadership changes aimed at driving revenue growth across its diverse product portfolio, such as the Realize performance advertising platform and DeeperDive AI tool for publishers, which enhances engagement and monetization opportunities through advanced AI-driven content solutions.
- Unlock comprehensive insights into our analysis of Taboola.com stock in this financial health report.
- Learn about Taboola.com's future growth trajectory here.
FinVolution Group (FINV)
Simply Wall St Financial Health Rating: ★★★★★☆
Overview: FinVolution Group is an investment holding company that operates in the online consumer finance industry across China, Indonesia, and internationally, with a market cap of approximately $1.21 billion.
Operations: The company generates revenue of CN¥13.57 billion from its Internet Software & Services segment.
Market Cap: $1.21B
FinVolution Group demonstrates financial stability with its short-term assets of CN¥20.2 billion surpassing both short and long-term liabilities, while maintaining more cash than total debt. Despite a modest 3% annual earnings growth over the past five years, recent earnings growth has accelerated to 6.7%, although it lags behind industry averages. The company trades at a significant discount to estimated fair value and offers high-quality earnings with stable weekly volatility of 7%. Recent activities include completing a US$77.26 million share buyback and announcing an annual dividend increase, reflecting robust capital management strategies amidst declining revenue forecasts for 2026.
- Click to explore a detailed breakdown of our findings in FinVolution Group's financial health report.
- Evaluate FinVolution Group's prospects by accessing our earnings growth report.

Where To Now?
- Click this link to deep-dive into the 355 companies within our US Penny Stocks screener.
- Contemplating Other Strategies? These 11 companies survived and thrived after COVID and have the right ingredients to survive Trump's tariffs. Discover why before your portfolio feels the trade war pinch.
This article by Simply Wall St is general in nature. We provide commentary based on historical data and analyst forecasts only using an unbiased methodology and our articles are not intended to be financial advice. It does not constitute a recommendation to buy or sell any stock, and does not take account of your objectives, or your financial situation. We aim to bring you long-term focused analysis driven by fundamental data. Note that our analysis may not factor in the latest price-sensitive company announcements or qualitative material. Simply Wall St has no position in any stocks mentioned.
Have feedback on this article? Concerned about the content? Get in touch with us directly. Alternatively, email editorial-team@simplywallst.com