


Lakeland Financial: recent performance catches investor attention
Lakeland Financial (LKFN) is back on some investors’ radars after a mixed run in the share price, with a small gain over the past 3 months following a modest pullback over the past month.
See our latest analysis for Lakeland Financial.
At around $58.12 per share, Lakeland Financial’s recent 7 day share price return of 2.04% contrasts with a softer 30 day move, while the 1 year total shareholder return of 7.92% points to steadier long term progress.
If this kind of steady banking name interests you, it can be useful to broaden your search with a curated list of other financials and quality names via the 20 top founder-led companies
With Lakeland Financial trading around $58.12, an indicated intrinsic discount of roughly 41% and some upside to analyst targets, the key question is whether this points to a genuine opportunity or whether the market already reflects future growth.
Price-to-Earnings of 14.2x: Is it justified?
On a P/E of 14.2x at a last close of $58.12, Lakeland Financial trades at a richer valuation than many US bank peers, which points to the market placing a premium on its earnings.
The P/E multiple compares the share price to earnings per share and is a common way to see how much investors are paying for each dollar of current profits in sectors like banking, where earnings and dividends are key focus areas.
Here, Lakeland Financial’s P/E of 14.2x sits above the US Banks industry average of 11.4x and also above the estimated fair P/E of 10.5x. This suggests the market is valuing its earnings more highly than both the sector and the level our fair ratio work indicates the valuation could drift toward over time.
Explore the SWS fair ratio for Lakeland Financial
Result: Price-to-Earnings of 14.2x (OVERVALUED)
However, a richer 14.2x P/E and a roughly 41% intrinsic discount estimate could both prove fragile if revenue or net income growth trends weaken.
Find out about the key risks to this Lakeland Financial narrative.
Another view: cash flows tell a different story
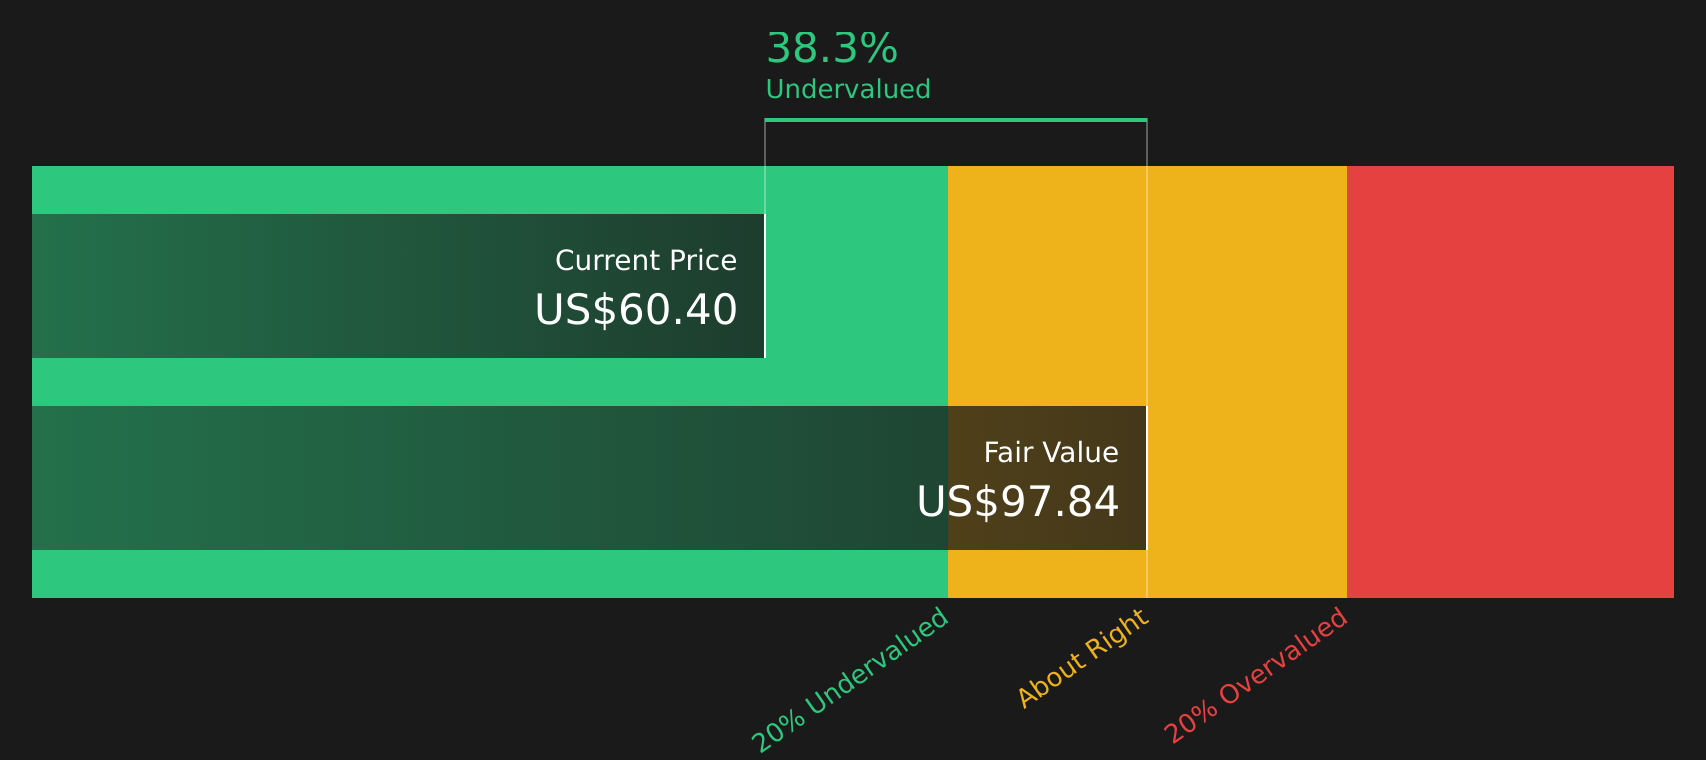
While the 14.2x P/E screens as expensive against bank peers and the fair ratio of 10.5x, the SWS DCF model suggests something very different. With an estimated future cash flow value of $98.41 versus a share price of $58.12, the model points to Lakeland Financial trading at a discount.
Look into how the SWS DCF model arrives at its fair value.
For you as an investor, that gap between an earnings based premium and a cash flow based discount raises a simple question: which signal should carry more weight in your decision making process?
Simply Wall St performs a discounted cash flow (DCF) on every stock in the world every day (check out Lakeland Financial for example). We show the entire calculation in full. You can track the result in your watchlist or portfolio and be alerted when this changes, or use our stock screener to discover 62 high quality undervalued stocks. If you save a screener we even alert you when new companies match - so you never miss a potential opportunity.
Next Steps
Mixed signals on valuation and growth potential can feel confusing, so it makes sense to review the data yourself, weigh the trade offs, and then check our summary of 4 key rewards and 1 important warning sign.
Looking for more investment ideas?
If Lakeland Financial has caught your eye, do not stop there. Use the tools available to widen your watchlist and pressure test your thinking against other opportunities.
- Target potential value candidates by scanning 62 high quality undervalued stocks that combine attractive pricing with solid underlying metrics.
- Strengthen your focus on resilience by checking 67 resilient stocks with low risk scores built around companies with lower overall risk scores.
- Spot potential underfollowed opportunities by reviewing the screener containing 25 high quality undiscovered gems that pair quality fundamentals with relatively limited market attention.
This article by Simply Wall St is general in nature. We provide commentary based on historical data and analyst forecasts only using an unbiased methodology and our articles are not intended to be financial advice. It does not constitute a recommendation to buy or sell any stock, and does not take account of your objectives, or your financial situation. We aim to bring you long-term focused analysis driven by fundamental data. Note that our analysis may not factor in the latest price-sensitive company announcements or qualitative material. Simply Wall St has no position in any stocks mentioned.
Have feedback on this article? Concerned about the content? Get in touch with us directly. Alternatively, email editorial-team@simplywallst.com