


- If you are wondering whether Energy Transfer's current price really reflects its value, or if there is still room on the table for long term investors, this article breaks that question down step by step.
- Energy Transfer closed at US$18.93, with returns of 14.1% year to date and 15.2% over the last year. These figures may influence how you think about both its potential upside and its risks.
- Recent coverage has focused on Energy Transfer's role as a large US pipeline and midstream partnership, its focus on fee based transportation and storage, and its exposure to broader energy market sentiment. Together, these themes help explain why the stock's returns over the last 3 and 5 years have been very large and why investors are paying closer attention to its valuation.
- Right now, Energy Transfer holds a 4/6 valuation score. The next sections will walk through what that figure means across different valuation methods and will also outline a way to think about value that ties the numbers back to the full investment story.
Find out why Energy Transfer's 15.2% return over the last year is lagging behind its peers.
Approach 1: Energy Transfer Discounted Cash Flow (DCF) Analysis
A Discounted Cash Flow model takes the cash flows a business is expected to generate in the future, then discounts those back into today’s dollars to estimate what the company might be worth right now.
For Energy Transfer, the latest twelve month Free Cash Flow is about $5.44b. Analyst and extrapolated projections used here point to Free Cash Flow of $7.19b in 2030, with a full ten year path of forecasts and estimates feeding into the model. Analysts provide inputs for the earlier years, and Simply Wall St extends that path further using its own assumptions.
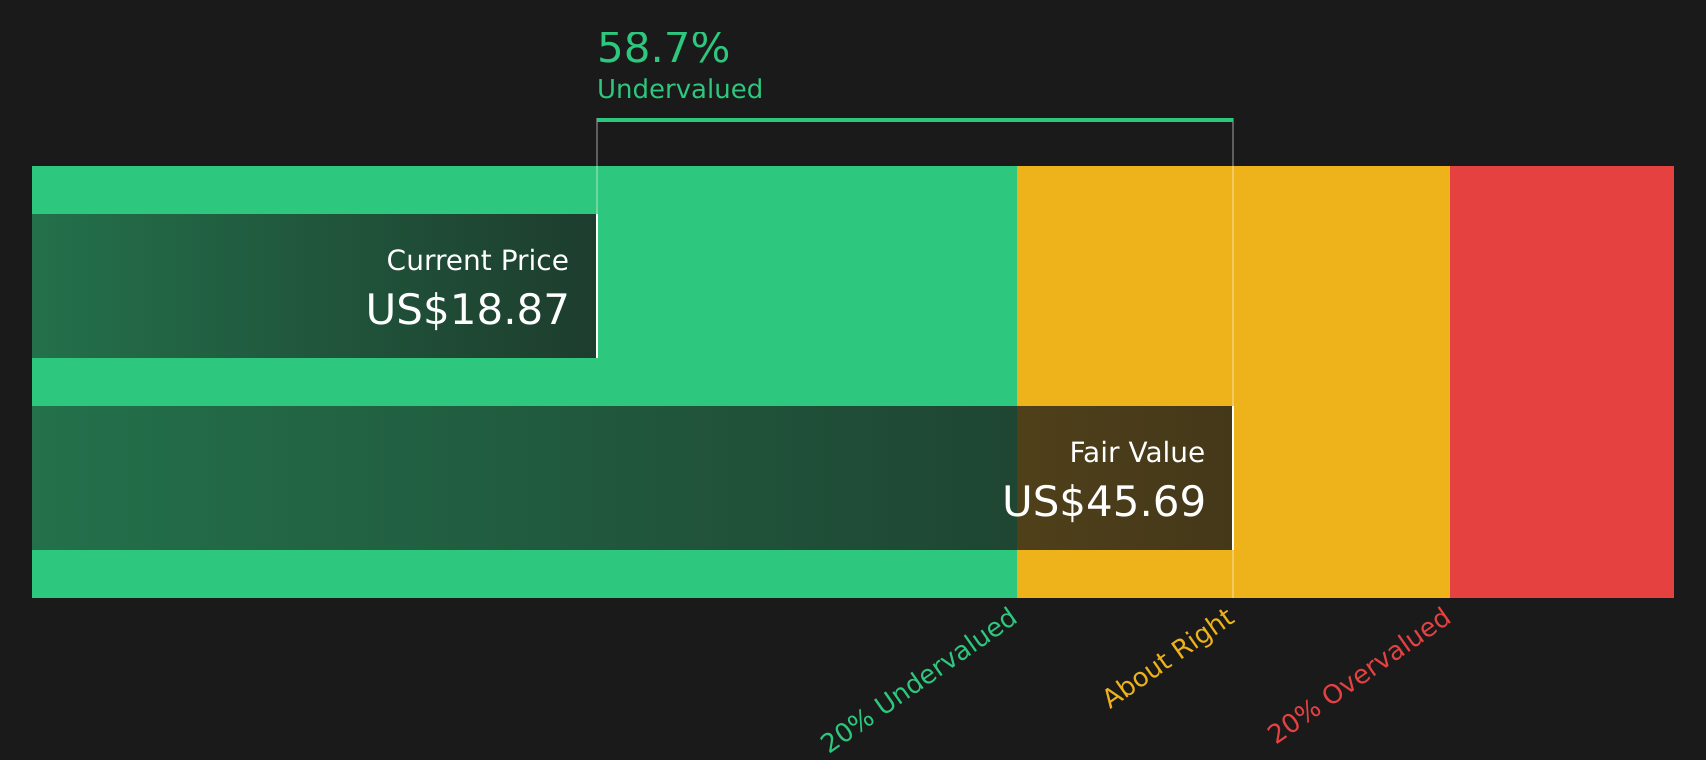
Using this 2 Stage Free Cash Flow to Equity model, the estimated intrinsic value comes out to $47.35 per unit. Against the recent price of $18.93, the DCF output suggests Energy Transfer trades at roughly a 60.0% discount, which indicates material upside relative to this model’s assumptions.
Result: UNDERVALUED
Our Discounted Cash Flow (DCF) analysis suggests Energy Transfer is undervalued by 60.0%. Track this in your watchlist or portfolio, or discover 62 more high quality undervalued stocks.
Approach 2: Energy Transfer Price vs Earnings
For a profitable business, the P/E ratio is a useful way to gauge how much you are paying for each dollar of earnings. It helps you see, in a single number, how the market values the company’s current profit stream.
What counts as a “normal” or “fair” P/E depends on how fast earnings are expected to grow and how risky those earnings are. Higher growth and lower perceived risk can justify a higher P/E, while slower growth or higher risk usually call for a lower one.
Energy Transfer currently trades on a P/E of 15.61x. That sits in line with the Oil and Gas industry average of 15.61x and below the peer average of 19.58x. Simply Wall St also calculates a “Fair Ratio” of 27.23x, which is an internally derived P/E that reflects factors such as earnings growth, industry, profit margin, market cap and risk profile.
This Fair Ratio can be more informative than a simple comparison with peers or the industry, because it adjusts for the specific characteristics of the company rather than assuming all businesses deserve similar multiples. With Energy Transfer’s actual P/E at 15.61x compared with a Fair Ratio of 27.23x, the shares appear undervalued on this metric.
Result: UNDERVALUED

P/E ratios tell one story, but what if the real opportunity lies elsewhere? Start investing in legacies, not executives. Discover our 20 top founder-led companies.
Upgrade Your Decision Making: Choose your Energy Transfer Narrative
Earlier it was mentioned that there is an even better way to understand valuation. Narratives on Simply Wall St’s Community page let you turn your view of Energy Transfer into a clear story that connects your assumptions for revenue, earnings and margins to a forecast, a fair value and a simple comparison with today’s price. It updates that story automatically when fresh news or earnings arrive and makes room for very different perspectives. For example, one investor might focus on the higher analyst fair value estimate of about US$25.00 based on stronger natural gas project execution, while another might anchor on the lower end around US$18.50 given concerns about project, contract and energy transition risks.
Do you think there's more to the story for Energy Transfer? Head over to our Community to see what others are saying!

This article by Simply Wall St is general in nature. We provide commentary based on historical data and analyst forecasts only using an unbiased methodology and our articles are not intended to be financial advice. It does not constitute a recommendation to buy or sell any stock, and does not take account of your objectives, or your financial situation. We aim to bring you long-term focused analysis driven by fundamental data. Note that our analysis may not factor in the latest price-sensitive company announcements or qualitative material. Simply Wall St has no position in any stocks mentioned.
Have feedback on this article? Concerned about the content? Get in touch with us directly. Alternatively, email editorial-team@simplywallst.com