


- Wondering if W. P. Carey is still fairly priced after its recent run, or if the current share price is giving you a margin of safety.
- The stock last closed at US$70.25, with returns of 3.9% over 7 days, a 4.8% decline over 30 days, 8.3% year to date and 21.0% over the past year, which may have shifted how some investors see its risk and reward trade off.
- Recent headlines around W. P. Carey have focused on its position within the real estate investment trust space and how income oriented investors view its role in a portfolio. This context, combined with the share price moves, has kept attention on whether the current valuation still lines up with investor expectations.
- Right now, W. P. Carey has a valuation score of 3/6. The key question is how different valuation methods interpret that score and whether a more complete framework for thinking about value offers you better insight by the end of this article.
Approach 1: W. P. Carey Discounted Cash Flow (DCF) Analysis
A Discounted Cash Flow model estimates what a company might be worth by projecting its future adjusted funds from operations, then discounting those cash flows back into today’s dollars.
For W. P. Carey, the model starts with last twelve month free cash flow of about $1.10b. Analyst and extrapolated projections run out to 2035, with estimated free cash flow of $1.87b in that year. Simply Wall St uses a 2 stage Free Cash Flow to Equity model based on adjusted funds from operations, combining analyst inputs for the nearer years with extrapolated growth beyond that.
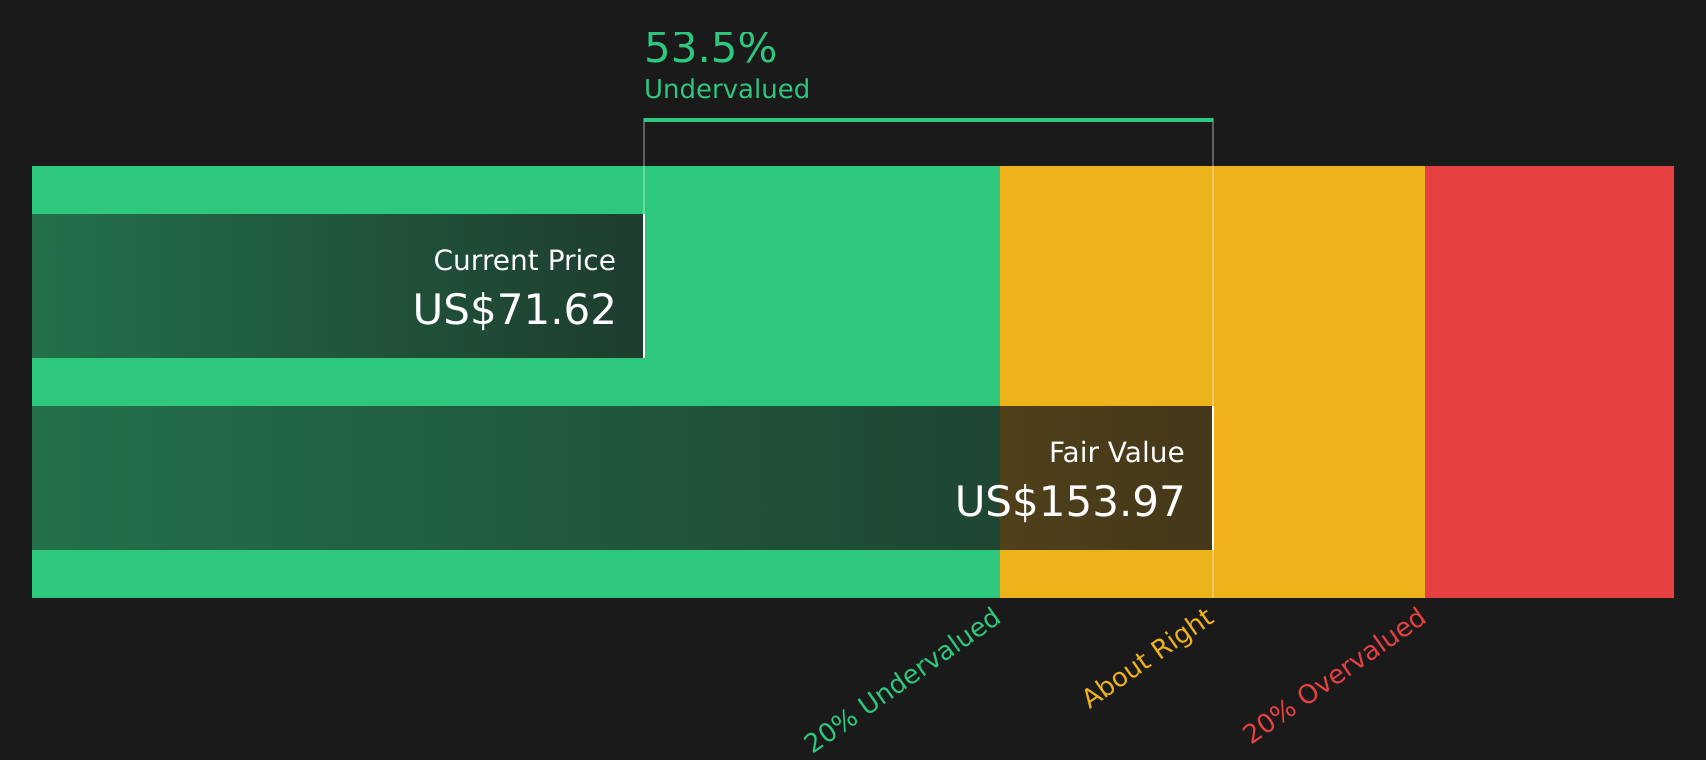
When all these projected cash flows are discounted back, the DCF model arrives at an estimated intrinsic value of about $156.37 per share. Compared with the recent share price of $70.25, this implies a discount of roughly 55.1%. On this method, the stock is currently screening as materially undervalued.
Result: UNDERVALUED
Our Discounted Cash Flow (DCF) analysis suggests W. P. Carey is undervalued by 55.1%. Track this in your watchlist or portfolio, or discover 62 more high quality undervalued stocks.
Approach 2: W. P. Carey Price vs Earnings
For profitable companies, the P/E ratio is a useful way to connect what you pay per share with the earnings the business is currently generating. It gives you a quick sense of how many dollars you are paying for each dollar of earnings.
What counts as a “normal” or “fair” P/E usually reflects how the market views a company’s growth prospects and risk. Higher growth and lower perceived risk can justify a higher multiple, while slower growth or higher risk often lines up with a lower one.
W. P. Carey is trading on a P/E of about 33.0x. That sits above the REITs industry average of roughly 14.8x and also above the peer group average of about 26.0x. Simply Wall St’s Fair Ratio for W. P. Carey is 35.9x, which is a proprietary estimate of what the P/E might be given factors such as its earnings profile, industry, profit margins, market cap and risk characteristics.
The Fair Ratio can be more informative than a simple peer or industry comparison because it aims to adjust for those company specific traits rather than treating all REITs as identical. Since 35.9x is above the current 33.0x, this framework suggests the shares are screening as undervalued on a P/E basis.
Result: UNDERVALUED

P/E ratios tell one story, but what if the real opportunity lies elsewhere? Start investing in legacies, not executives. Discover our 20 top founder-led companies.
Upgrade Your Decision Making: Choose your W. P. Carey Narrative
Earlier it was mentioned that there is an even better way to understand valuation, so Narratives are introduced here as a simple way for you to attach a clear story about W. P. Carey to specific forecasts for revenue, earnings and margins. These then flow through to an estimated fair value that you can compare with the current share price.
On Simply Wall St’s Community page, Narratives let you see and build these stories in an accessible format that updates automatically when fresh information comes in, such as earnings reports, news or new analyst targets. This means your view of fair value is always tied to the latest data rather than a static snapshot.
For W. P. Carey, one investor might build a Narrative that leans closer to the higher analyst price target of US$82.0, based on confidence in revenue growth, expanding profit margins and a P/E of 27.6x by 2029. Another investor might anchor to the lower target of US$68.0 because they are more focused on risks around tenant concentration, property sales and competition. By comparing each Narrative’s fair value to today’s price, you can then decide whether the gap between price and value is wide enough for you to consider buying, holding or selling.
Do you think there's more to the story for W. P. Carey? Head over to our Community to see what others are saying!

This article by Simply Wall St is general in nature. We provide commentary based on historical data and analyst forecasts only using an unbiased methodology and our articles are not intended to be financial advice. It does not constitute a recommendation to buy or sell any stock, and does not take account of your objectives, or your financial situation. We aim to bring you long-term focused analysis driven by fundamental data. Note that our analysis may not factor in the latest price-sensitive company announcements or qualitative material. Simply Wall St has no position in any stocks mentioned.
Have feedback on this article? Concerned about the content? Get in touch with us directly. Alternatively, email editorial-team@simplywallst.com