


- If you are wondering whether Williams Companies is priced attractively right now, it helps to start by looking at how the current market value lines up against the business fundamentals.
- The stock last closed at US$72.00, with a 7 day return of a 2.1% decline, a 30 day return of a 3.7% decline, and longer term returns of 18.3% year to date and 36.3% over the past year, with a very large 5 year gain of 286.5% adding important context.
- Recent price moves sit against ongoing interest in US midstream energy infrastructure and investor focus on companies involved in natural gas transportation and storage. This backdrop helps explain why Williams Companies has stayed on many investors' watchlists as they assess how current pricing lines up with perceived quality and risk.
- On Simply Wall St's valuation checks, Williams Companies currently scores 2 out of 6. Next you will see how different valuation approaches line up with that score, followed by a more complete way to think about valuation beyond any single metric.
Williams Companies scores just 2/6 on our valuation checks. See what other red flags we found in the full valuation breakdown.
Approach 1: Williams Companies Discounted Cash Flow (DCF) Analysis
A Discounted Cash Flow model estimates what a company might be worth by projecting future cash flows and discounting them back to today, so you can compare that value to the current share price.
For Williams Companies, the DCF uses a 2 Stage Free Cash Flow to Equity approach based on cash flow projections. The company’s last twelve months Free Cash Flow is about $2.17b. Analyst estimates and Simply Wall St extrapolations suggest Free Cash Flow reaching about $9.12b in 2035, with interim projections such as $4.68b in 2030. Ten year projections are discounted back to today using this model.
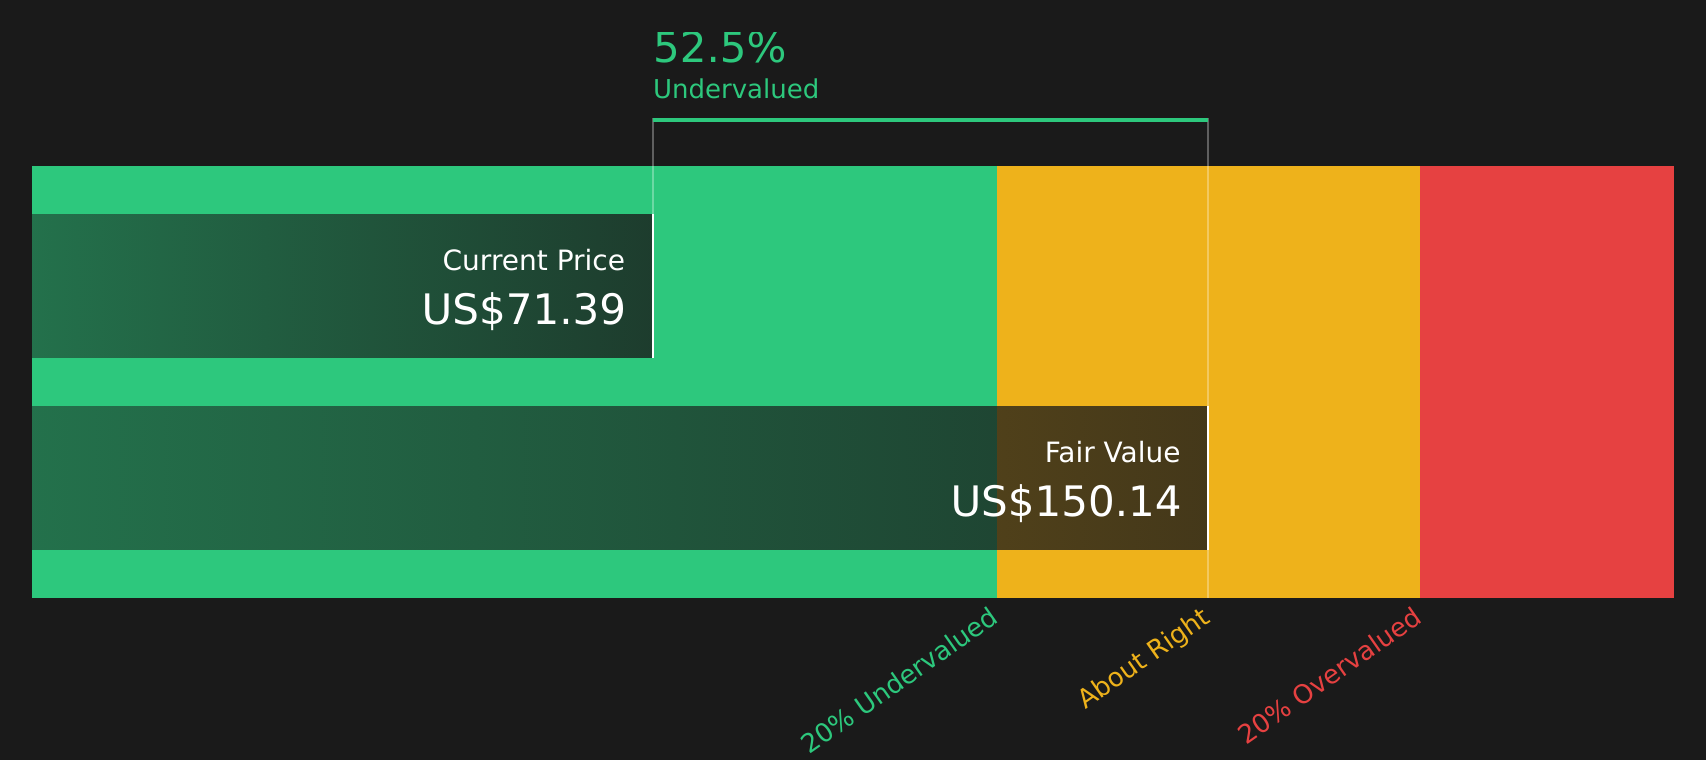
Bringing all those discounted cash flows together produces an estimated intrinsic value of about $135.84 per share. Compared with the recent share price of US$72.00, this implies the stock is trading at a 47.0% discount to the model’s estimate. This points to Williams Companies being materially undervalued on this DCF view.
Result: UNDERVALUED
Our Discounted Cash Flow (DCF) analysis suggests Williams Companies is undervalued by 47.0%. Track this in your watchlist or portfolio, or discover 59 more high quality undervalued stocks.
Approach 2: Williams Companies Price vs Earnings
For a profitable company like Williams Companies, the P/E ratio is a useful way to relate what you pay for each share to the earnings that support that price. It helps you see how many dollars investors are currently paying for each dollar of earnings.
What counts as a "normal" or "fair" P/E depends on how the market views a company’s growth potential and risk. Higher expected growth or lower perceived risk can support a higher P/E, while lower growth or higher risk often line up with a lower P/E.
Williams Companies currently trades on a P/E of 33.67x. That is above both the Oil and Gas industry average P/E of 15.59x and the peer group average of 16.35x. Simply Wall St’s proprietary Fair Ratio for Williams Companies is 28.86x, which reflects factors such as earnings growth, industry, profit margins, market cap and specific risks.
This Fair Ratio is more tailored than a simple comparison with peers or industry averages, because it adjusts for the company’s own profile rather than assuming all Oil and Gas companies should trade on the same multiple. Comparing 33.67x with the Fair Ratio of 28.86x suggests Williams Companies is trading richer than that tailored benchmark.
Result: OVERVALUED

P/E ratios tell one story, but what if the real opportunity lies elsewhere? Start investing in legacies, not executives. Discover our 20 top founder-led companies.
Upgrade Your Decision Making: Choose your Williams Companies Narrative
Earlier it was mentioned that there is an even better way to understand valuation. Narratives on Simply Wall St give you a clear story behind the numbers by linking your view of Williams Companies to specific forecasts for revenue, earnings and margins. This is then turned into a Fair Value that you can compare with the current price to decide whether the stock looks attractive or expensive. The platform’s Community page lets you see different Narratives side by side. For example, one Narrative lines up with a higher Fair Value around US$90.00, built on assumptions like 15.3% annual revenue growth and 24.3% profit margins by 2029. Another is closer to the lower analyst end around US$49.47, using assumptions such as revenue of US$10.6b, 31.1% profit margins and a 22.5x P/E in 2028. All of these update automatically as new earnings or news arrive so your Williams story and Fair Value stay tied to the latest information.
For Williams Companies however we will make it really easy for you with previews of two leading Williams Companies Narratives:
🐂 Williams Companies Bull Case
Fair value: US$76.75 per share
Implied pricing gap vs last close: about 6.2% undervalued using this narrative
Revenue growth assumption: 11.03% a year
- Focuses on expanding pipeline and LNG terminal connections that are expected to support volume, revenue and cash flow across high demand regions.
- Highlights a fully contracted project backlog, decarbonization projects and regulatory support that together aim to support margins and earnings visibility.
- Flags key risks such as heavy reliance on natural gas growth, high capital spending, potential stranded assets and sensitivity to permitting, regulation and funding costs.
🐻 Williams Companies Bear Case
Fair value: US$56.99 per share
Implied pricing gap vs last close: about 26.4% overvalued using this narrative
Revenue growth assumption: 8.62% a year
- Emphasises the risk that faster decarbonization, renewables and storage could reduce long term natural gas demand and leave assets underused.
- Points to high capital spending, US focused exposure and permitting challenges as factors that could pressure returns and margins if conditions turn less favourable.
- Suggests that, even with earnings growth, the required P/E in the bearish case may be hard to justify if investor expectations stay high relative to industry levels.
Do you think there's more to the story for Williams Companies? Head over to our Community to see what others are saying!

This article by Simply Wall St is general in nature. We provide commentary based on historical data and analyst forecasts only using an unbiased methodology and our articles are not intended to be financial advice. It does not constitute a recommendation to buy or sell any stock, and does not take account of your objectives, or your financial situation. We aim to bring you long-term focused analysis driven by fundamental data. Note that our analysis may not factor in the latest price-sensitive company announcements or qualitative material. Simply Wall St has no position in any stocks mentioned.
Have feedback on this article? Concerned about the content? Get in touch with us directly. Alternatively, email editorial-team@simplywallst.com