


Why Dyne Therapeutics is on investors’ radar today
Dyne Therapeutics (DYN) has drawn attention after recent trading, with the stock closing at US$18.84 and posting a 26.8% return over the past month. This performance has prompted closer scrutiny of its risk reward profile.
See our latest analysis for Dyne Therapeutics.
Recent trading strength, including a 9.9% 7 day share price return and a 26.8% 30 day share price return, sits alongside a 127.5% 1 year total shareholder return. This indicates that momentum has been building over both shorter and longer horizons.
If you are looking beyond Dyne Therapeutics for other ideas in high growth areas, this could be a good moment to scan the market using our screener of 36 healthcare AI stocks
With Dyne still loss making, yet carrying a market value of about US$3.1b and trading at a very large discount to some analyst targets, is the recent surge the start of a bargain, or is future growth already priced in?
Price to Book of 3.2x: Is it justified?
On a P/B of 3.2x, Dyne Therapeutics trades below the 5.5x average of its closest peers, while sitting above the broader US biotechs industry average of 2.2x. With the last close at $18.84 and a market value of about $3.1b, the share price is being compared to a company that is still loss making and generating less than $1m in revenue.
P/B compares a company’s market value with the net assets on its balance sheet, which matters for a clinical stage biotech where tangible assets and cash are key reference points. A lower P/B than peer companies can suggest the market is assigning a more cautious value to the same dollar of net assets, while a higher P/B than the wider industry can reflect stronger expectations around a specific drug pipeline or platform, in this case Dyne’s FORCE platform targeting neuromuscular diseases.
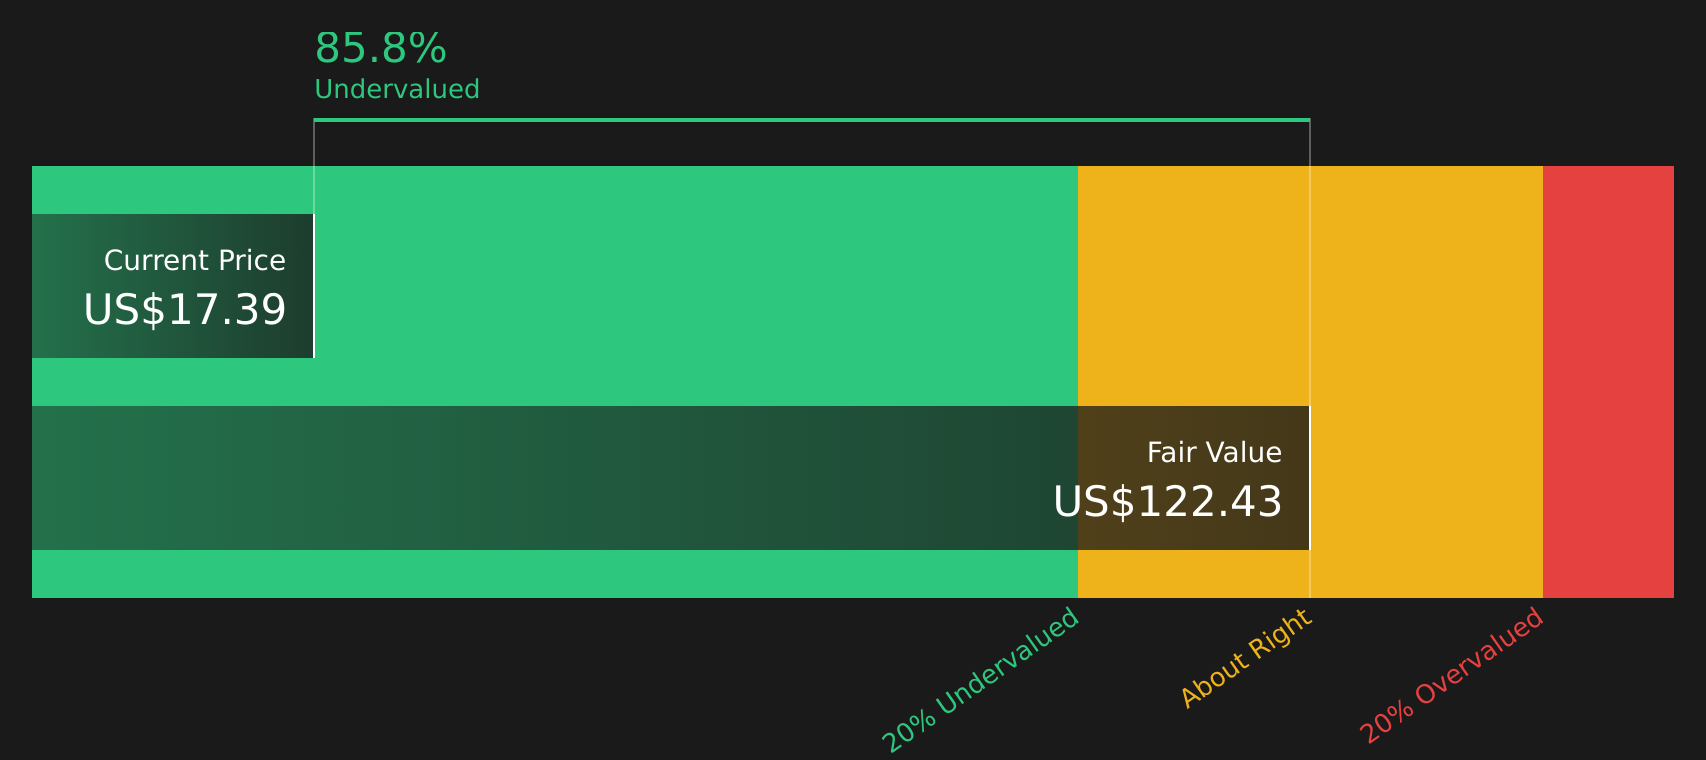
Here, the picture is mixed. The P/B of 3.2x is described as good value against a 5.5x peer average, which points to a discount relative to similar names. Yet the same 3.2x is considered expensive against the 2.2x US biotechs industry average. Layered on top of that, our DCF model indicates Dyne at $18.84 is trading 85% below an estimated future cash flow value of $126.01, which frames the current price as very low compared to that model’s fair value calculation.
See what the numbers say about this price — find out in our valuation breakdown.
Result: Price to book ratio of 3.2x (UNDERVALUED).
However, there are still clear pressure points, including Dyne’s US$446.214m net loss and the fact that it remains a clinical-stage company without reported revenue.
Find out about the key risks to this Dyne Therapeutics narrative.
Another view: cash flows paint a very different picture
While the 3.2x P/B ratio places Dyne Therapeutics between peers and the wider industry, the SWS DCF model points in a far stronger direction. At $18.84, the share price sits 85% below an estimated cash flow value of $126.01. This suggests a very large valuation gap. The key question is whether that gap reflects opportunity or simply optimistic assumptions about future cash generation.
Look into how the SWS DCF model arrives at its fair value.
Simply Wall St performs a discounted cash flow (DCF) on every stock in the world every day (check out Dyne Therapeutics for example). We show the entire calculation in full. You can track the result in your watchlist or portfolio and be alerted when this changes, or use our stock screener to discover 58 high quality undervalued stocks. If you save a screener we even alert you when new companies match - so you never miss a potential opportunity.
Next Steps
With sentiment clearly split between the recent share price strength and the company’s ongoing losses, it makes sense to look at the full picture yourself and move promptly while the data is fresh, starting with the 1 key reward and 3 important warning signs.
Looking for more investment ideas?
If Dyne has caught your attention, do not stop there. Broaden your watchlist now so you are not looking back wishing you had acted sooner.
- Target value opportunities early by scanning our list of 58 high quality undervalued stocks that pair quality fundamentals with pricing that may not fully reflect them yet.
- Protect your downside potential by focusing on companies from the 68 resilient stocks with low risk scores that score well on resilience and financial risk checks.
- Spot tomorrow’s potential standouts today with the screener containing 25 high quality undiscovered gems that highlight quality businesses the wider market might not be watching closely yet.
This article by Simply Wall St is general in nature. We provide commentary based on historical data and analyst forecasts only using an unbiased methodology and our articles are not intended to be financial advice. It does not constitute a recommendation to buy or sell any stock, and does not take account of your objectives, or your financial situation. We aim to bring you long-term focused analysis driven by fundamental data. Note that our analysis may not factor in the latest price-sensitive company announcements or qualitative material. Simply Wall St has no position in any stocks mentioned.
Have feedback on this article? Concerned about the content? Get in touch with us directly. Alternatively, email editorial-team@simplywallst.com