


NOV (NOV) is back in focus after announcing a US$200 million plan to roughly double capacity at its subsea flexible pipe plant in Açu, Brazil, alongside earnings that topped expectations and a higher regular dividend.
See our latest analysis for NOV.
At a share price of US$18.78, NOV has delivered an 11.12% 90 day share price return and a 63.44% 1 year total shareholder return. This suggests recent momentum aligns with interest around the Brazil capacity expansion, earnings beat, and higher dividend.
If the Brazil expansion has you thinking about where else capital intensive growth stories might emerge, it could be worth scanning 28 power grid technology and infrastructure stocks for other infrastructure linked opportunities.
With NOV trading at US$18.78 and sitting at a roughly 36% intrinsic discount alongside solid recent returns, the key question is whether that signals undervaluation or if the market is already pricing in future growth.
Most Popular Narrative: 11.3% Overvalued
With NOV at $18.78 versus a narrative fair value of $16.88, the current price sits above that framework and brings the underlying thesis into focus.
Sustained investment in energy infrastructure, including LNG and gas processing driven by global energy security needs and rising energy demand in developing markets, supports long-term growth in NOV's composite pipe, process systems, and related offerings, enhancing recurring and project-based revenues. (Revenue)
Curious how modest revenue assumptions, a step up in margins, and a slightly richer future P/E all combine to justify that fair value gap and discount rate narrative.
Result: Fair Value of $16.88 (OVERVALUED)
Have a read of the narrative in full and understand what's behind the forecasts.
However, there is still real execution risk if tariffs and inflation squeeze margins, or if lumpy orders in areas like Flexible Pipe delay revenue and backlog conversion.
Find out about the key risks to this NOV narrative.
Another Take On Value
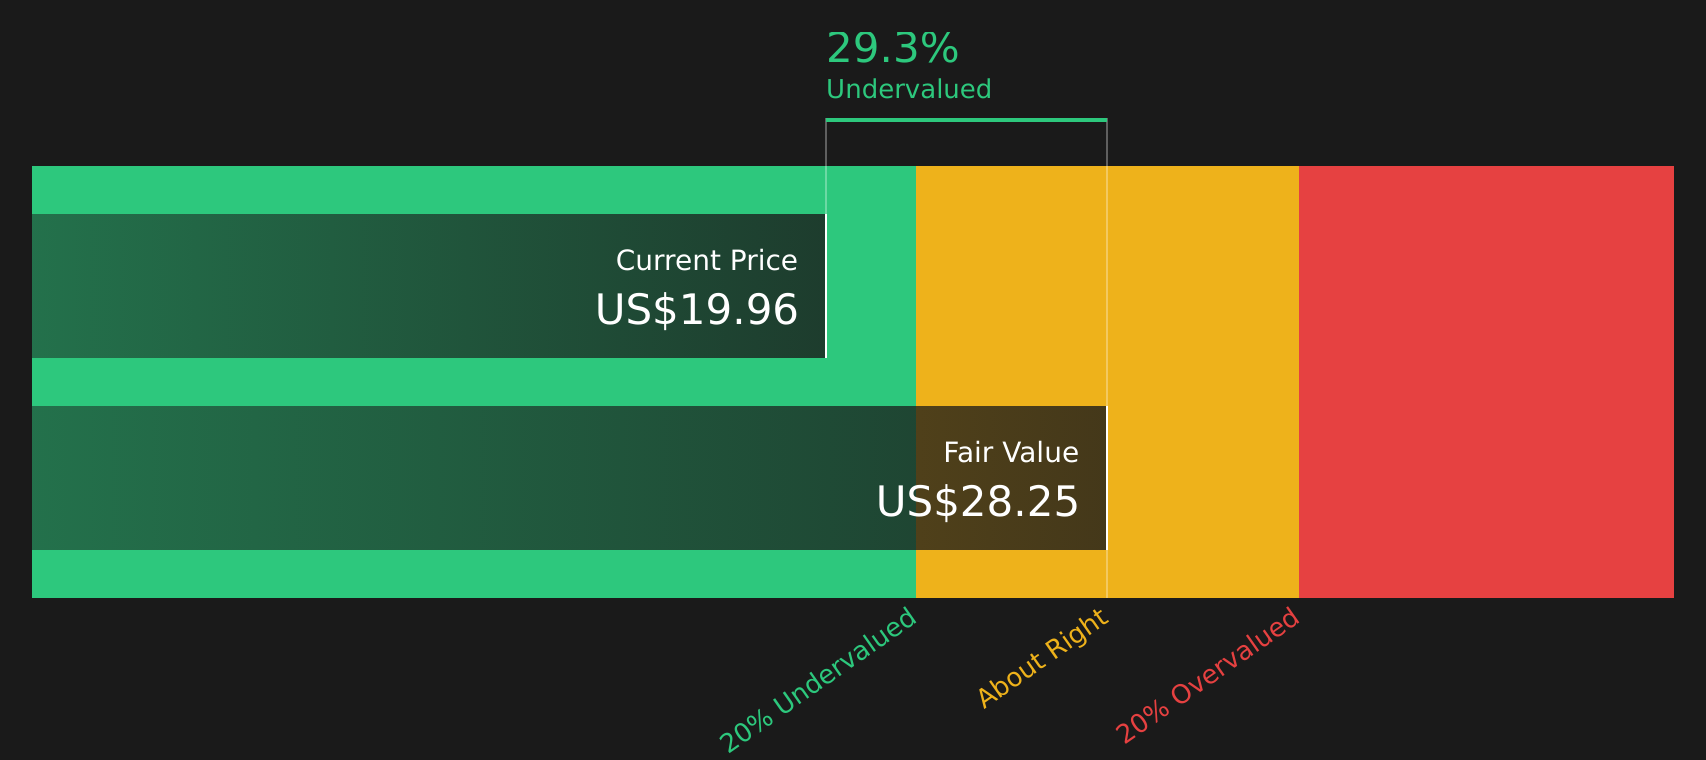
While the narrative framework points to NOV trading about 11.3% above a fair value of $16.88, the SWS DCF model comes to a very different conclusion, with an estimate of $29.17 and NOV at a 35.6% discount. Which set of assumptions feels more realistic to you?
Look into how the SWS DCF model arrives at its fair value.
Simply Wall St performs a discounted cash flow (DCF) on every stock in the world every day (check out NOV for example). We show the entire calculation in full. You can track the result in your watchlist or portfolio and be alerted when this changes, or use our stock screener to discover 58 high quality undervalued stocks. If you save a screener we even alert you when new companies match - so you never miss a potential opportunity.
Next Steps
Are these mixed signals, or is a clear message starting to form? Take a closer look at the data now and consider NOV's 2 key rewards and 4 important warning signs with 2 key rewards and 4 important warning signs
Looking for more investment ideas?
If NOV has sharpened your focus, do not stop here. Broaden your watchlist now with a few targeted ideas that could fit different roles in your portfolio.
- Spot potential value opportunities early by scanning screener containing 25 high quality undiscovered gems that pair strong underlying fundamentals with relatively low market attention.
- Build a core of resilient holdings using the solid balance sheet and fundamentals stocks screener (40 results) to focus on companies with sturdy financial footing.
- Target dependable income streams by reviewing 13 dividend fortresses that may suit investors seeking higher yields.
This article by Simply Wall St is general in nature. We provide commentary based on historical data and analyst forecasts only using an unbiased methodology and our articles are not intended to be financial advice. It does not constitute a recommendation to buy or sell any stock, and does not take account of your objectives, or your financial situation. We aim to bring you long-term focused analysis driven by fundamental data. Note that our analysis may not factor in the latest price-sensitive company announcements or qualitative material. Simply Wall St has no position in any stocks mentioned.
Have feedback on this article? Concerned about the content? Get in touch with us directly. Alternatively, email editorial-team@simplywallst.com