


Moody's (MCO) is back in focus after quarterly earnings topped analyst expectations, with contributions from both its ratings and analytics divisions, along with higher full year earnings guidance and an increased quarterly dividend.
See our latest analysis for Moody's.
Despite a softer 30 day share price return of 5.91% and a 90 day share price return of 16.66%, Moody's 1 year total shareholder return of 12.47% and 3 year total shareholder return of 53.95% point to momentum that has built over time. The latest earnings beat, guidance lift, dividend increase and product launches like the Token Integration Engine are now helping reset expectations around both growth prospects and risk.
If Moody's earnings news has you thinking more broadly about financial market infrastructure, it could be a good time to hunt for other opportunities in data rich business models such as 20 top founder-led companies
With Moody's shares returning 12.47% over 1 year and sitting about 23% below the average analyst price target, the big question now is whether the recent earnings strength leaves room for upside or if markets already price in future growth.
Most Popular Narrative: 19.5% Undervalued
According to the narrative by andre_santos, the fair value for Moody's sits at $551.41 compared with the last close of $444.10, framing the recent earnings surprise against a higher long term valuation anchor.
📈 Moody's has established itself as one of the global standards in credit ratings, a status reflected in its wide economic moat and consequently stellar operating margins in the 45 to 50% range. The company consistently generates returns on invested capital roughly 5x its cost of capital, a strong signal of disciplined and effective capital allocation by management.
Curious what turns that wide moat and high returns into a higher fair value. The narrative leans on sustained profitability, measured growth and a disciplined cost of capital story.
Result: Fair Value of $551.41 (UNDERVALUED)
Have a read of the narrative in full and understand what's behind the forecasts.
However, investors still need to watch for pressure on Moody's Analytics from AI driven alternatives, as well as any regulatory or trust shifts affecting global credit rating demand.
Find out about the key risks to this Moody's narrative.
Another Take on Value: P/E Ratios Send a Mixed Signal
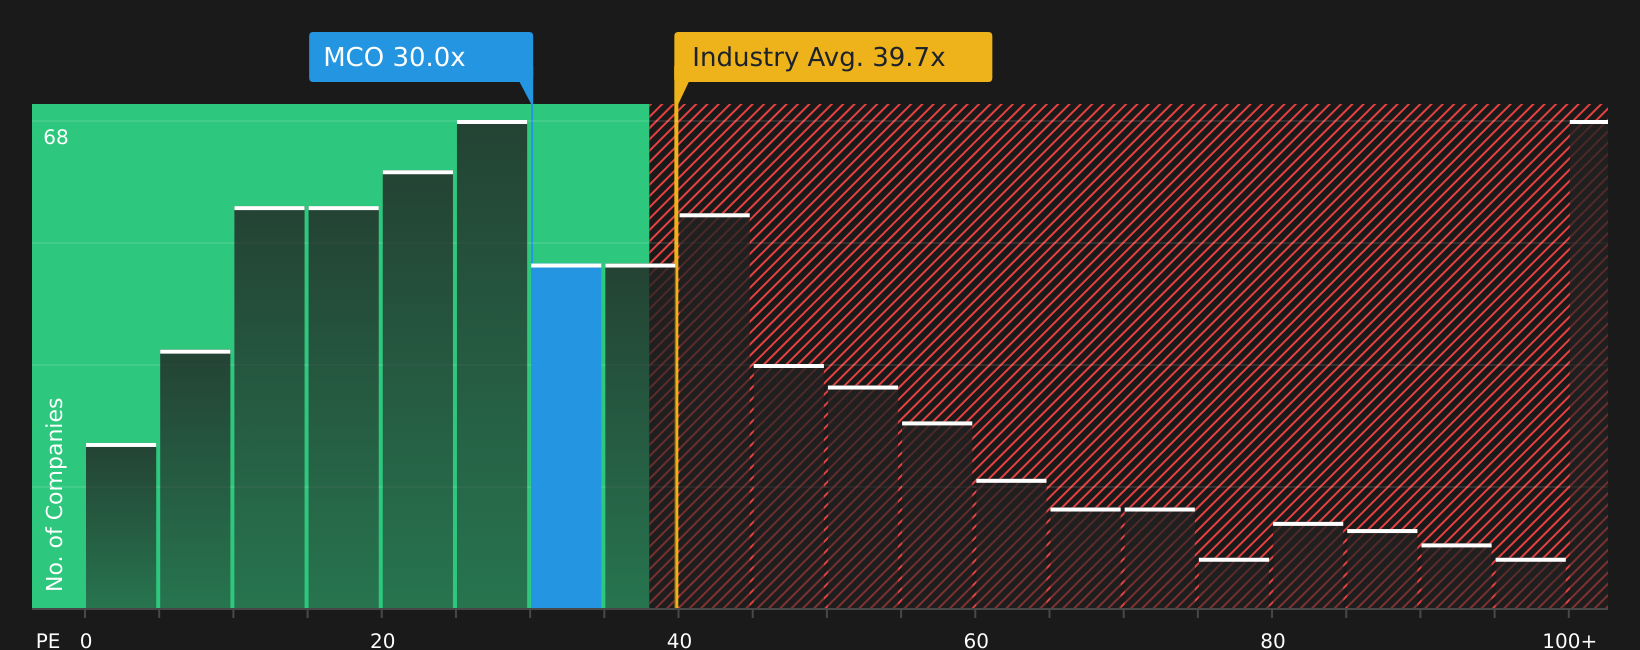
While the user narrative leans on a higher fair value of $551.41, the current P/E of 32.1x tells a more cautious story. Moody's trades below the US Capital Markets industry average of 36.1x, yet well above a fair ratio of 16.6x and a peer average of 28.2x. This combination points to valuation risk if sentiment or growth expectations cool.
This gap raises a simple question for you as an investor: is the current price reflecting durable quality, or leaving limited room if growth or profitability settle closer to market expectations?
See what the numbers say about this price — find out in our valuation breakdown.
Simply Wall St performs a discounted cash flow (DCF) on every stock in the world every day (check out Moody's for example). We show the entire calculation in full. You can track the result in your watchlist or portfolio and be alerted when this changes, or use our stock screener to discover 62 high quality undervalued stocks. If you save a screener we even alert you when new companies match - so you never miss a potential opportunity.
Next Steps
Seeing both optimism and caution in the story so far. Now is a good moment to check the numbers yourself, weigh the upside against the concerns, and see the 4 key rewards and 2 important warning signs.
Looking for more investment ideas?
If Moody's has sharpened your focus, do not stop here. Broaden your watchlist now or risk missing opportunities sitting in plain sight on other screens.
- Target resilient cash generators by scanning companies with a solid balance sheet and fundamentals stocks screener (40 results) that can better handle shocks and still fund growth.
- Hunt for potential value opportunities using the 62 high quality undervalued stocks to spot stocks where quality and pricing may be out of sync.
- Prioritize stability and income by reviewing the 68 resilient stocks with low risk scores for businesses with lower risk scores that may support steadier returns.
This article by Simply Wall St is general in nature. We provide commentary based on historical data and analyst forecasts only using an unbiased methodology and our articles are not intended to be financial advice. It does not constitute a recommendation to buy or sell any stock, and does not take account of your objectives, or your financial situation. We aim to bring you long-term focused analysis driven by fundamental data. Note that our analysis may not factor in the latest price-sensitive company announcements or qualitative material. Simply Wall St has no position in any stocks mentioned.
Have feedback on this article? Concerned about the content? Get in touch with us directly. Alternatively, email editorial-team@simplywallst.com