


- This article explores whether Liberty Energy's share price still reflects good value, or if the easier gains may already have occurred, by considering what the current price might be implying about the company.
- Liberty Energy closed at US$27.67, with a 4.1% decline over the last 7 days, a 3.2% gain over 30 days, a 46.6% return year to date, and a 169.7% return over the past year.
- Recent coverage has focused on Liberty Energy as part of broader discussions around US energy services companies and how investors are treating the sector after a strong run for certain names. This context helps explain why some traders are reassessing risk and reward, even after multi year returns of 116.9% over 3 years and 168.1% over 5 years.
- Liberty Energy currently scores 2 out of 6 on Simply Wall St's valuation checks. The rest of this article looks at how different valuation methods interpret that score, then finishes with a broader way to think about what the market might be pricing in.
Liberty Energy scores just 2/6 on our valuation checks. See what other red flags we found in the full valuation breakdown.
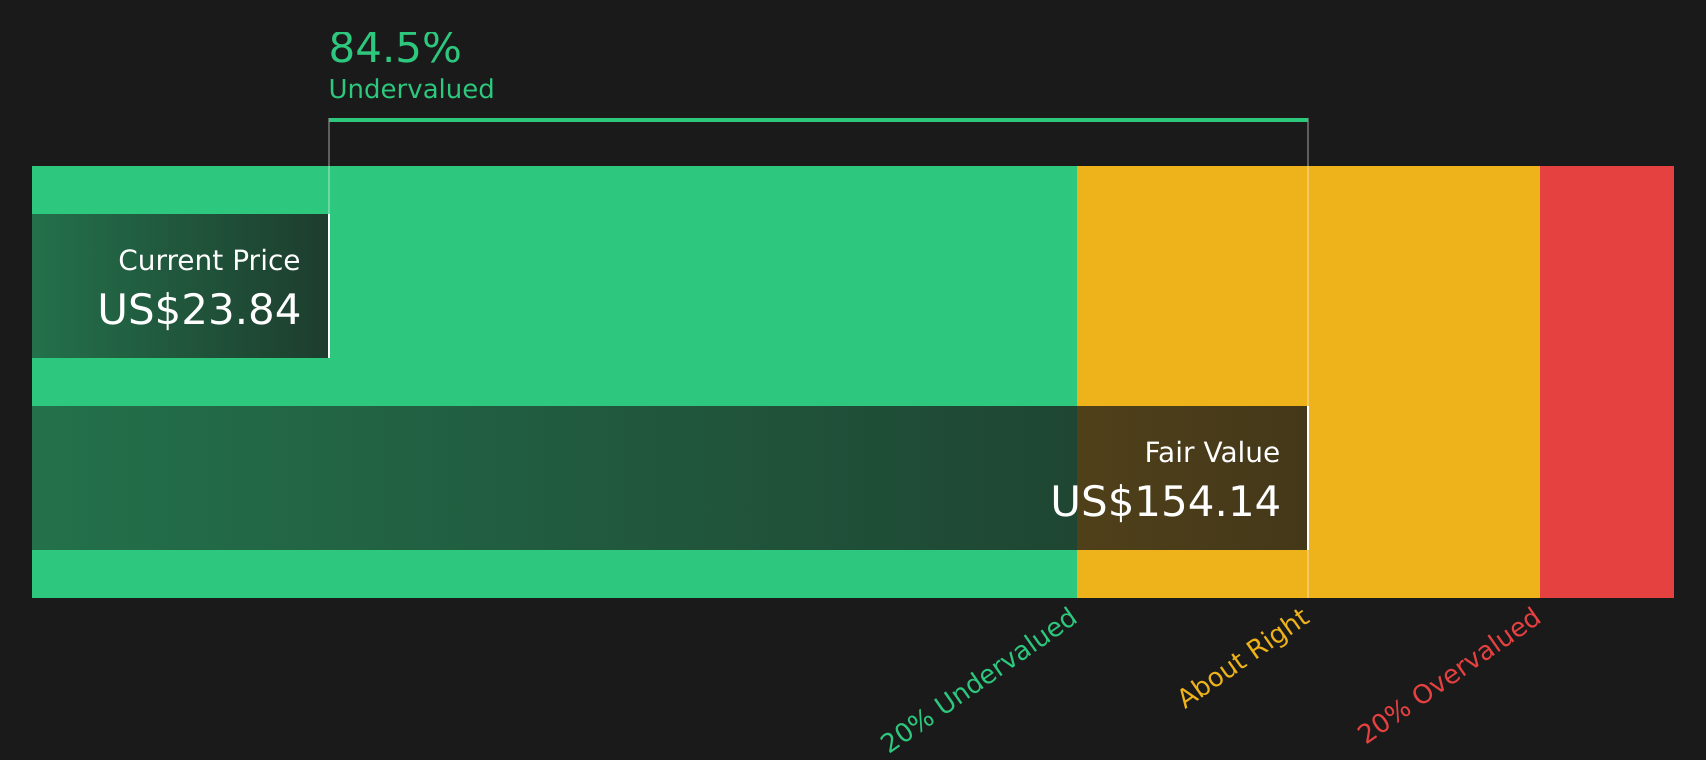
Approach 1: Liberty Energy Discounted Cash Flow (DCF) Analysis
A Discounted Cash Flow model estimates what a company could be worth by projecting its future cash flows and discounting them back to today’s value using a required return. It tries to answer what all those future dollars are worth in today’s terms.
For Liberty Energy, the model uses a 2 Stage Free Cash Flow to Equity approach. The latest twelve month free cash flow is about $42.6 million, and analysts plus extrapolated estimates point to swings in free cash flow over the coming years, with a projected $403 million in 2030. Beyond the explicit analyst window, Simply Wall St extends the projections to 2035 using its own growth assumptions.
Adding up all those discounted cash flows gives an estimated intrinsic value of $150.28 per share. Compared with the recent share price of $27.67, the DCF implies Liberty Energy is 81.6% undervalued based on these inputs and assumptions.
Result: UNDERVALUED
Our Discounted Cash Flow (DCF) analysis suggests Liberty Energy is undervalued by 81.6%. Track this in your watchlist or portfolio, or discover 62 more high quality undervalued stocks.
Approach 2: Liberty Energy Price vs Earnings
For a profitable company like Liberty Energy, the P/E ratio is a useful way to link what you pay per share to the earnings the business is currently generating. It helps you see how many dollars of price the market is assigning to each dollar of earnings.
What counts as a “normal” P/E depends on what investors expect for future growth and how risky they view those earnings. Higher expected growth or lower perceived risk can justify a higher P/E, while lower growth expectations or higher risk usually line up with a lower P/E.
Liberty Energy currently trades on a P/E of 30.32x, compared with a peer average of 21.38x and an Energy Services industry average of about 26.33x. Simply Wall St’s Fair Ratio metric for Liberty Energy is 7.80x. This Fair Ratio is a proprietary estimate of the P/E that might be appropriate after considering factors such as earnings growth, industry, profit margins, company size and identified risks. This makes it more tailored than a simple peer or industry comparison.
Compared with this Fair Ratio, Liberty Energy’s current P/E of 30.32x is higher, which points to the shares looking expensive on this metric.
Result: OVERVALUED

P/E ratios tell one story, but what if the real opportunity lies elsewhere? Start investing in legacies, not executives. Discover our 20 top founder-led companies.
Upgrade Your Decision Making: Choose your Liberty Energy Narrative
Earlier there was mention of a better way to understand valuation. This is where Narratives come in, giving you a simple story that links your view of Liberty Energy to a set of numbers such as future revenue, earnings, margins and a Fair Value that you can compare with the current share price.
A Narrative on Simply Wall St is your explanation of what you think is happening at a company, written out as a clear storyline that is then tied directly to a financial forecast and an implied Fair Value, instead of just relying on a single P/E or DCF output.
Within the Community page on Simply Wall St, used by millions of investors, Narratives are set up so you can quickly see how your Fair Value compares with the latest market price and decide whether the gap between the two is large enough for you to consider buying, holding or selling.
These Narratives update automatically when new information such as fresh earnings, bond deals or power agreements appears in the data feed. This means your Fair Value view does not sit frozen while the story around the company moves.
For Liberty Energy, one Narrative might lean toward the lower Fair Value of about US$21.00, focusing on decarbonization and cost pressures. Another might sit closer to the higher Fair Value of about US$34.00, highlighting the Power buildout and data center partnerships. You can decide which story and Fair Value better match your own expectations.
For Liberty Energy however we will make it really easy for you with previews of two leading Liberty Energy Narratives:
Fair value: US$28.85
Implied pricing: about 4.1% undervalued versus the recent US$27.67 share price
Revenue growth used in this narrative: 9.45%
- Focuses on persistent demand for oil, gas and power, with Liberty Energy positioned through completion services and a growing Power business tied to data centers and industrial customers.
- Highlights technology focused fleets and partnerships such as Oklo and microgrid projects as reasons why Liberty Energy could win higher value, longer duration contracts.
- Flags risks around a softer completions market, energy transition pressures, long lead times for power projects and cost inflation that could hold back margins and earnings.
Fair value: US$21.00
Implied pricing: about 31.8% overvalued versus the recent US$27.67 share price
Revenue growth used in this narrative: 6.00%
- Starts from the view that accelerating decarbonization, regulation and mature shale fields could limit long term demand for Liberty Energy's core oil and gas services.
- Points to cost inflation and rapid efficiency gains across the sector as potential headwinds for margins and returns, even if activity holds up for a while.
- Accepts that technology, power projects and strong customer relationships could support results, but still treats bond funded growth and long dated power buildouts as sources of execution risk.
Do you think there's more to the story for Liberty Energy? Head over to our Community to see what others are saying!

This article by Simply Wall St is general in nature. We provide commentary based on historical data and analyst forecasts only using an unbiased methodology and our articles are not intended to be financial advice. It does not constitute a recommendation to buy or sell any stock, and does not take account of your objectives, or your financial situation. We aim to bring you long-term focused analysis driven by fundamental data. Note that our analysis may not factor in the latest price-sensitive company announcements or qualitative material. Simply Wall St has no position in any stocks mentioned.
Have feedback on this article? Concerned about the content? Get in touch with us directly. Alternatively, email editorial-team@simplywallst.com