


- If you are wondering whether Teekay Tankers at around US$78.21 is still offering value or has already priced in the story, the key is to understand what current valuation signals are really saying about the stock.
- The share price has moved recently, with returns of 8.6% over the last 7 days, 8.9% over the last 30 days, 51.9% year to date, 116.8% over 1 year, 128.7% over 3 years, and a very large gain over 5 years.
- Recent news has focused on Teekay Tankers as an established player in the oil and gas shipping space, with investors paying close attention to how the company is positioned within the broader tanker market. Market commentary has also highlighted how changes in sector sentiment can quickly affect shipping stocks, which helps explain the sharp moves seen in the share price.
- Teekay Tankers currently carries a valuation score of 5 out of 6. The next sections break down how different valuation methods arrive at that view, with an even more useful way to think about value waiting at the end of the article.
Approach 1: Teekay Tankers Discounted Cash Flow (DCF) Analysis
A Discounted Cash Flow model estimates what a company could be worth by projecting its future cash flows and discounting them back to today, so that all future dollars are expressed in current terms.
For Teekay Tankers, the model used is a 2 Stage Free Cash Flow to Equity approach. The latest twelve month free cash flow stands at about $233.3 million. Analysts and extrapolated estimates point to free cash flow of $420.0 million in 2026 and $500.6 million in 2035, with interim projections such as $296.0 million in 2027 and $361.0 million in 2028, all in US$ terms.
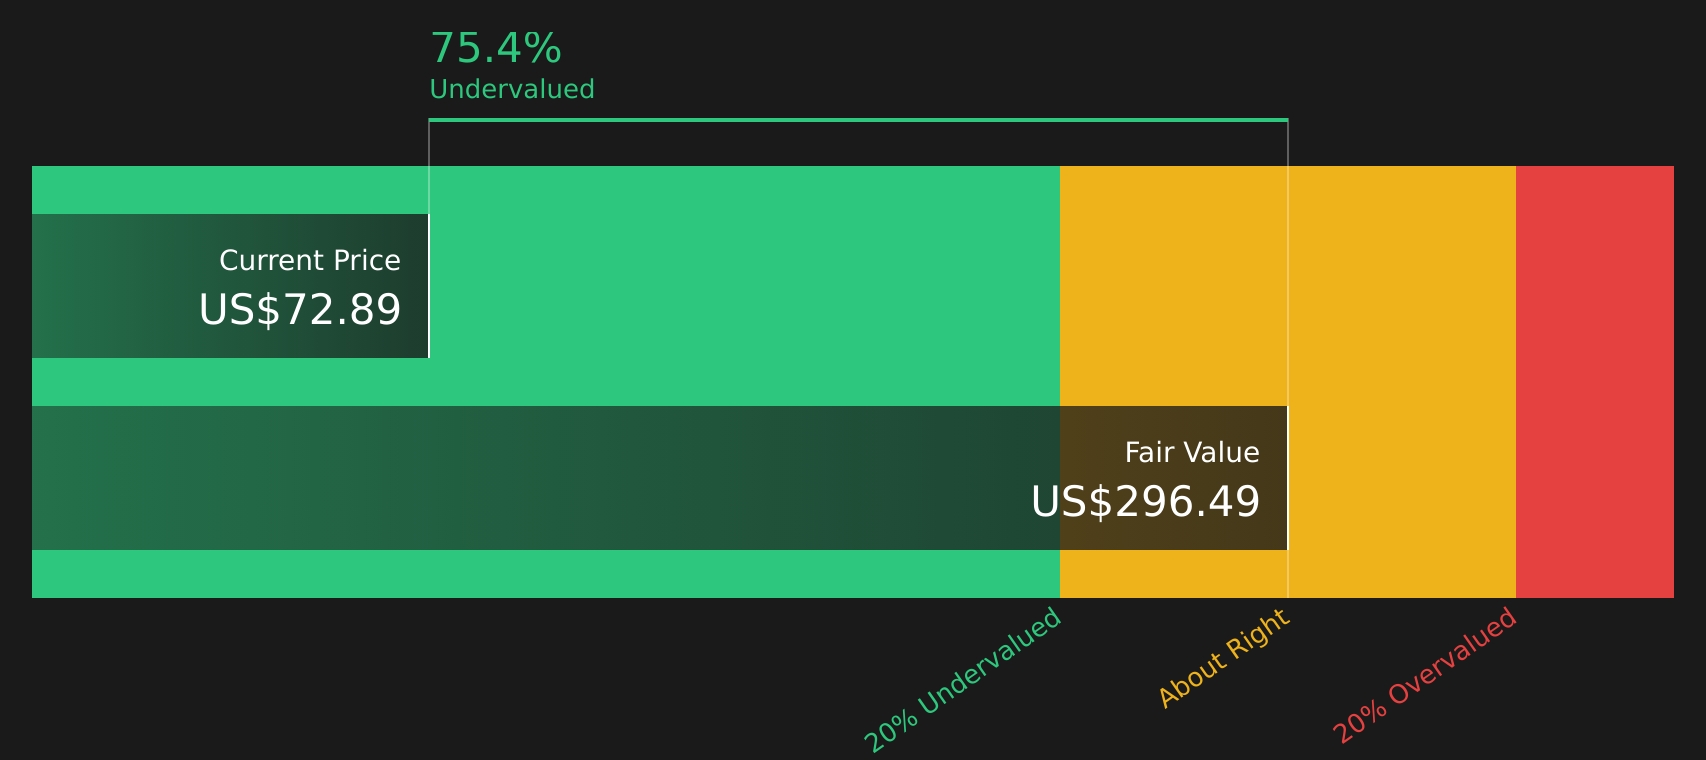
After discounting these projected cash flows, Simply Wall St arrives at an estimated intrinsic value of about $296.49 per share. Against a current share price around $78.21, this corresponds to a 73.6% discount, indicating that the shares are trading well below this model’s estimate of value.
Result: UNDERVALUED
Our Discounted Cash Flow (DCF) analysis suggests Teekay Tankers is undervalued by 73.6%. Track this in your watchlist or portfolio, or discover 62 more high quality undervalued stocks.
Approach 2: Teekay Tankers Price vs Earnings
For profitable companies, the P/E ratio is a useful way to think about value because it links what you pay directly to the earnings the business is producing today. A higher P/E usually reflects higher growth expectations or lower perceived risk, while a lower P/E can point to lower expected growth or higher risk.
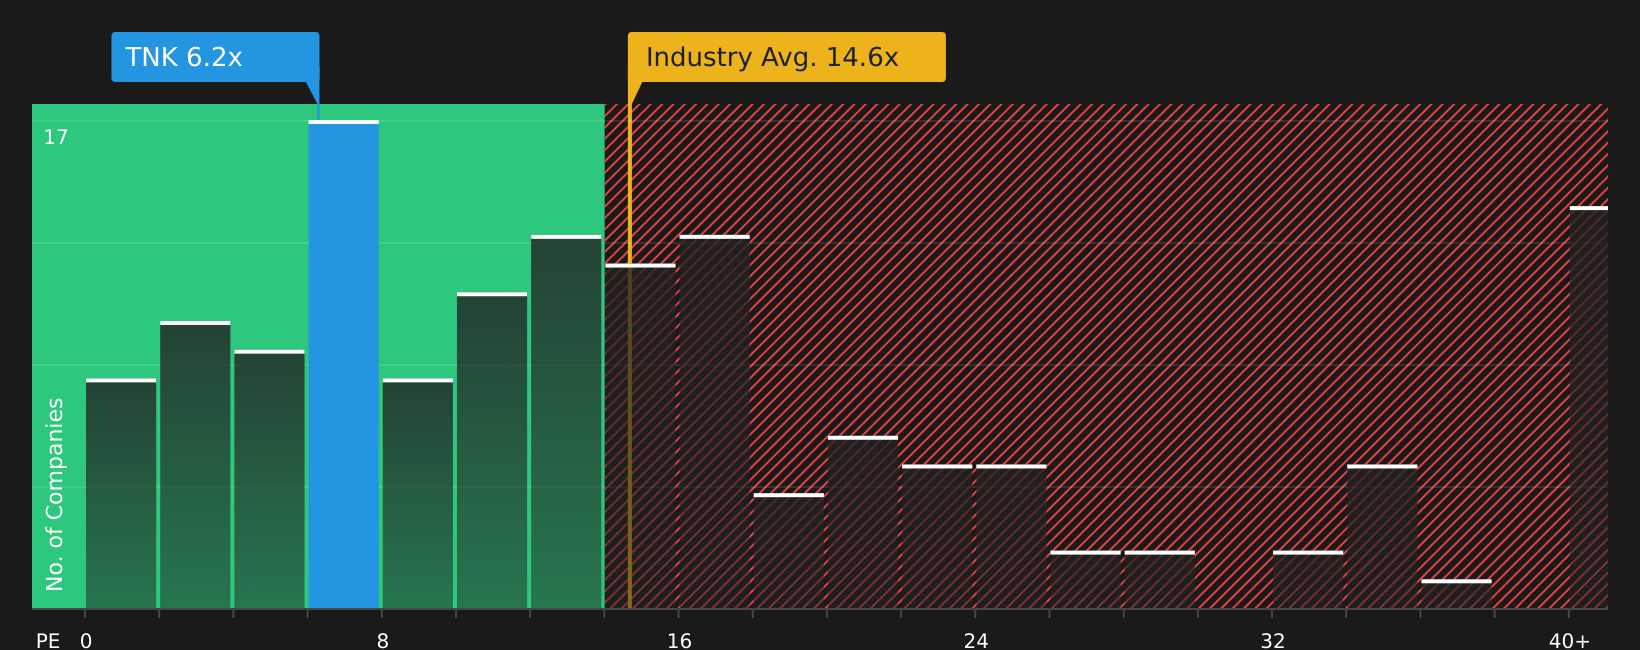
Teekay Tankers trades on a P/E of 7.72x. That sits below the Oil and Gas industry average P/E of 15.56x and below the peer group average of 12.98x. Simply Wall St also calculates a “Fair Ratio” for Teekay Tankers of 13.90x, which is the P/E that would typically be expected given factors such as its earnings growth profile, industry, profit margins, market cap and assessed risks.
This Fair Ratio is more tailored than a simple comparison to industry or peers because it adjusts for the company’s specific characteristics rather than assuming all Oil and Gas names deserve similar valuations. Comparing the Fair Ratio of 13.90x with the current P/E of 7.72x indicates that the shares are pricing in a lower multiple than this model would imply.
Result: UNDERVALUED
P/E ratios tell one story, but what if the real opportunity lies elsewhere? Start investing in legacies, not executives. Discover our 20 top founder-led companies.
Upgrade Your Decision Making: Choose your Teekay Tankers Narrative
Earlier it was mentioned that there is an even better way to think about valuation. On Simply Wall St that comes through Narratives, where you attach your own story about Teekay Tankers to specific assumptions for revenue, earnings, margins and fair value. You then let the platform on the Community page translate that story into a forecast and a fair value that you can compare directly with today’s price to help decide whether you see the stock as offering opportunity or risk.
Because Narratives update automatically when new earnings or news land, you can quickly see how your view stacks up against other investors. For example, one Teekay Tankers Narrative might lean cautious with a fair value around US$69.0, while another sees more upside with a fair value near US$84.0. That spread makes it clear how different assumptions about tanker rates, regulation and capital allocation can lead to very different conclusions about what the shares are worth.
For Teekay Tankers, however, we will make it really easy for you with previews of two leading Teekay Tankers Narratives:
Fair value in this bullish narrative: US$84.00
Implied discount to this fair value relative to the current US$78.21 price: about 6.9%.
Revenue trend assumption: 12.79% annual decline.
- This bullish view leans on tight fleet supply, shipyard constraints, and an aging global tanker fleet, which together are expected to support vessel earnings and asset values.
- It highlights strong cash generation and a conservative balance sheet as giving Teekay Tankers room to pursue buybacks or expand the fleet into adjacent segments while still funding operations.
- Key risks in this narrative focus on decarbonization policies, tightening environmental rules, and tanker industry cyclicality, which could add pressure to future utilization, margins, and cash flows.
Fair value in this cautious narrative: US$69.00
Implied premium to this fair value relative to the current US$78.21 price: about 11.8%.
Revenue trend assumption: 15.35% annual decline.
- This more cautious view centers on global decarbonization and efficiency gains that are expected to reduce oil cargo volumes and weigh on utilization over time.
- It points to higher compliance and upgrade costs for an aging fleet, along with spot market exposure, as pressure points for earnings quality and cash generation.
- Supportive factors in this narrative include disciplined fleet renewal, cost efficiency, and the potential for tanker market tightness to limit downside during weaker freight periods.
If you want to see how these narratives evolve as new data lands and how other investors frame the same stock using different assumptions, See what the community is saying about Teekay Tankers.
Do you think there's more to the story for Teekay Tankers? Head over to our Community to see what others are saying!

This article by Simply Wall St is general in nature. We provide commentary based on historical data and analyst forecasts only using an unbiased methodology and our articles are not intended to be financial advice. It does not constitute a recommendation to buy or sell any stock, and does not take account of your objectives, or your financial situation. We aim to bring you long-term focused analysis driven by fundamental data. Note that our analysis may not factor in the latest price-sensitive company announcements or qualitative material. Simply Wall St has no position in any stocks mentioned.
Have feedback on this article? Concerned about the content? Get in touch with us directly. Alternatively, email editorial-team@simplywallst.com