


The United States market has experienced a notable upswing, climbing 4.4% in the last week and an impressive 32% over the past year, with earnings projected to grow by 16% annually. In this environment, identifying stocks that may be undervalued requires a keen eye for potential growth and resilience amidst broader market gains, as highlighted by companies like BillionToOne and others.
Top 10 Undervalued Stocks Based On Cash Flows In The United States
| Name | Current Price | Fair Value (Est) | Discount (Est) |
| Uranium Energy (UEC) | $13.36 | $26.41 | 49.4% |
| Roku (ROKU) | $98.20 | $193.48 | 49.2% |
| National Bank Holdings (NBHC) | $40.12 | $79.88 | 49.8% |
| Intapp (INTA) | $24.82 | $49.43 | 49.8% |
| Fluence Energy (FLNC) | $13.20 | $26.13 | 49.5% |
| First Internet Bancorp (INBK) | $21.82 | $43.01 | 49.3% |
| First Busey (BUSE) | $25.89 | $51.67 | 49.9% |
| Ellington Financial (EFC) | $12.10 | $23.90 | 49.4% |
| DNOW (DNOW) | $12.18 | $24.11 | 49.5% |
| Dime Community Bancshares (DCOM) | $34.41 | $67.79 | 49.2% |
Here we highlight a subset of our preferred stocks from the screener.
BillionToOne (BLLN)
Overview: BillionToOne, Inc. is a precision diagnostics company that focuses on quantifying biology to develop molecular diagnostics, with a market cap of $3.65 billion.
Operations: The company's revenue is primarily derived from its Medical Labs & Research segment, totaling $305.11 million.
Estimated Discount To Fair Value: 47.9%
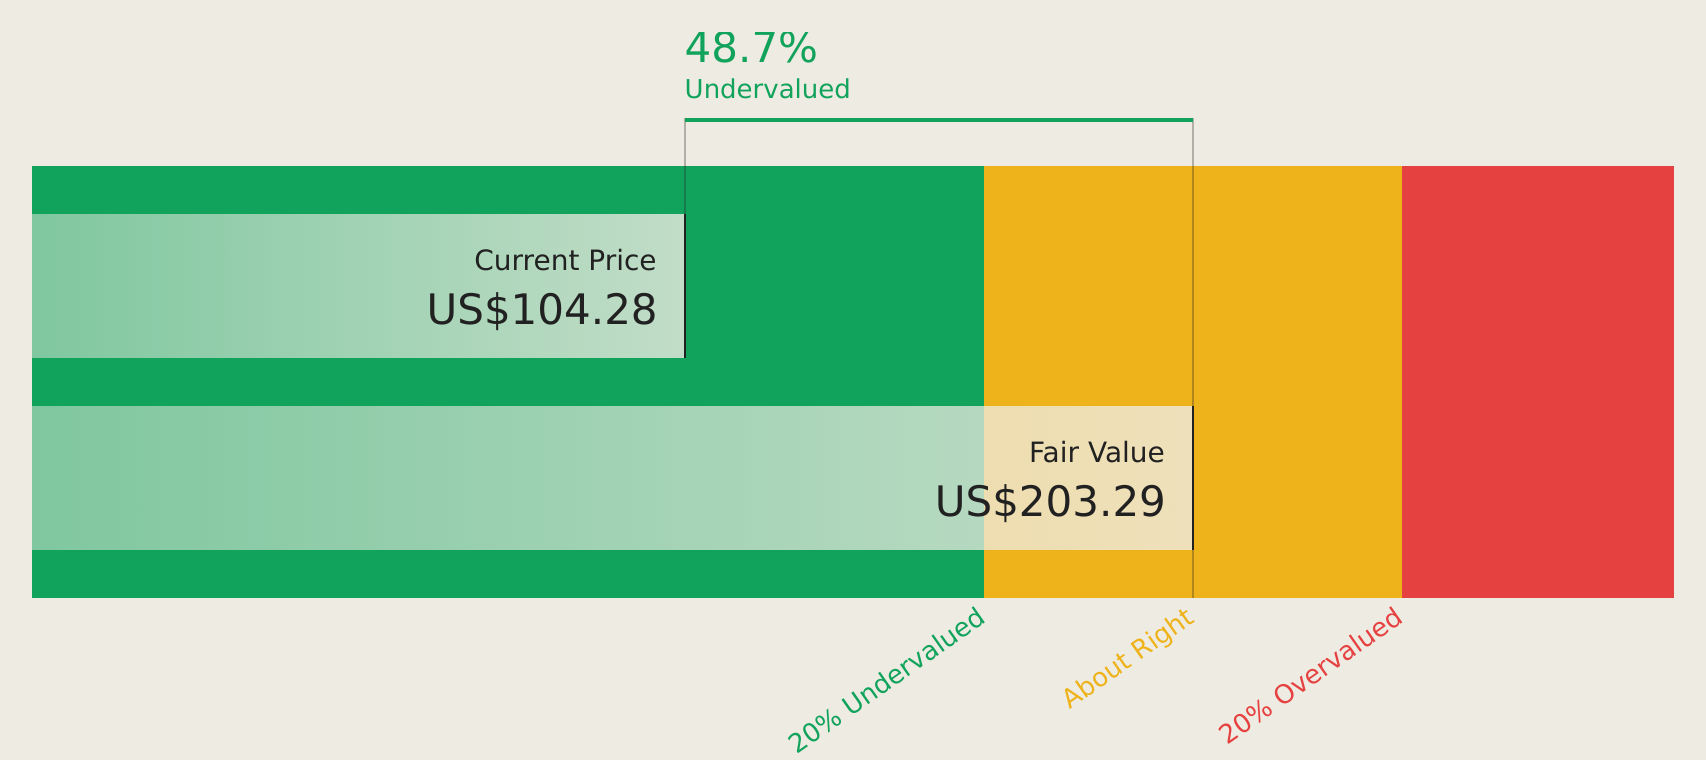
BillionToOne is trading at US$85.5, significantly below its estimated future cash flow value of US$164.18, suggesting it may be undervalued based on cash flows. The company recently became profitable and forecasts substantial earnings growth of 39.1% annually over the next three years, outpacing the broader U.S. market's growth rate. Despite high volatility in share price, BillionToOne's revenue is projected to grow between 41% and 46% in 2026, supported by innovative product launches and strategic collaborations.
- Our growth report here indicates BillionToOne may be poised for an improving outlook.
- Get an in-depth perspective on BillionToOne's balance sheet by reading our health report here.
Kaspi.kz (KSPI)
Overview: Joint Stock Company Kaspi.kz, along with its subsidiaries, offers payments, marketplace, and fintech solutions for consumers and merchants in Kazakhstan, Azerbaijan, and Ukraine with a market cap of $14.18 billion.
Operations: The company's revenue segments consist of Fintech at 1.54 billion KZT, Payments at 658.73 million KZT, and Marketplace at 1.93 billion KZT.
Estimated Discount To Fair Value: 42.5%
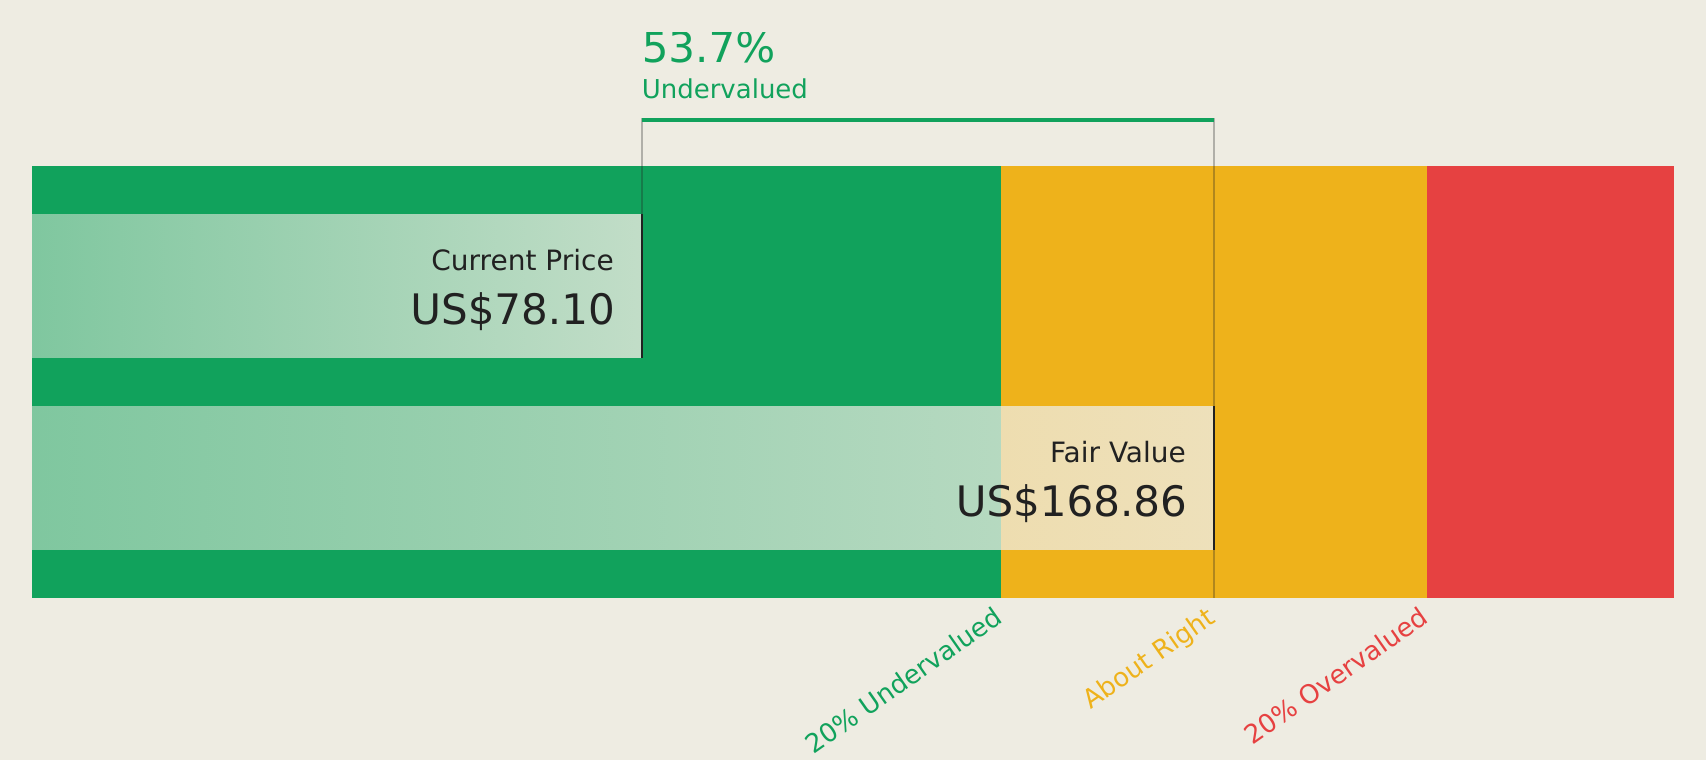
Kaspi.kz, trading at $75.65, is priced below its estimated future cash flow value of $131.51, highlighting potential undervaluation based on cash flows. Despite a decline in profit margins from 40.9% to 26.5%, the company forecasts earnings growth of 17.7% annually, surpassing the U.S. market's average growth rate. However, its dividend yield of 9.69% is not well covered by free cash flows, and recent revenue growth has been robust but accompanied by a drop in net income year-over-year.
- Our earnings growth report unveils the potential for significant increases in Kaspi.kz's future results.
- Click here and access our complete balance sheet health report to understand the dynamics of Kaspi.kz.
Flowserve (FLS)
Overview: Flowserve Corporation designs, manufactures, distributes, and services industrial flow management equipment across various regions including the United States, Canada, Mexico, Europe, the Middle East, Africa, and the Asia Pacific with a market cap of approximately $9.58 billion.
Operations: Flowserve's revenue is primarily generated from its Flow Control Division, contributing $1.50 billion, and its Flowserve Pump Division, which accounts for $3.24 billion.
Estimated Discount To Fair Value: 12.9%
Flowserve, trading at US$75.92, is undervalued relative to its future cash flow value of US$87.15, indicating potential for appreciation. Despite a recent net loss of US$29 million in Q4 2025 due to large one-off items, annual earnings grew by 22.5%. Forecasted earnings growth of 21.2% annually exceeds the U.S. market average, though revenue growth lags behind market expectations. Recent shareholder activism and executive changes may influence future strategic directions.
- Upon reviewing our latest growth report, Flowserve's projected financial performance appears quite optimistic.
- Take a closer look at Flowserve's balance sheet health here in our report.

Summing It All Up
- Navigate through the entire inventory of 161 Undervalued US Stocks Based On Cash Flows here.
- Already own these companies? Bring clarity to your investment decisions by linking up your portfolio with Simply Wall St, where you can monitor all the vital signs of your stocks effortlessly.
- Simply Wall St is a revolutionary app designed for long-term stock investors, it's free and covers every market in the world.
Searching for a Fresh Perspective?
- Explore high-performing small cap companies that haven't yet garnered significant analyst attention.
- Diversify your portfolio with solid dividend payers offering reliable income streams to weather potential market turbulence.
- Fuel your portfolio with companies showing strong growth potential, backed by optimistic outlooks both from analysts and management.
This article by Simply Wall St is general in nature. We provide commentary based on historical data and analyst forecasts only using an unbiased methodology and our articles are not intended to be financial advice. It does not constitute a recommendation to buy or sell any stock, and does not take account of your objectives, or your financial situation. We aim to bring you long-term focused analysis driven by fundamental data. Note that our analysis may not factor in the latest price-sensitive company announcements or qualitative material. Simply Wall St has no position in any stocks mentioned.
Have feedback on this article? Concerned about the content? Get in touch with us directly. Alternatively, email editorial-team@simplywallst.com