


Why Manchester United Stock Is on Investors’ Radar
Without a fresh headline event driving today’s move, interest in Manchester United (NYSE:MANU) is centering on how its recent share performance lines up with fundamentals like revenue, profitability and the current market valuation.
See our latest analysis for Manchester United.
At a share price of US$17.47, Manchester United has a 1 day share price return of about a 1.7% decline. Its year to date share price return of 10.71% and 1 year total shareholder return of 43.08% suggest momentum that contrasts with the weaker 3 year total shareholder return of 23.01%.
If you are comparing Manchester United with other media and entertainment names, it can be useful to widen the lens and review 18 top founder-led companies
With the shares sitting at US$17.47, trailing a 43.08% 1 year total return and trading at an apparent discount to both analyst targets and some intrinsic estimates, investors may need to consider whether this represents a buying opportunity or whether the market is already pricing in future growth.
Price to Sales of 3.5x: Is it justified?
On a P/S basis, Manchester United looks expensive at 3.5x sales compared with several benchmarks, even with the last close at $17.47 and a discount to some intrinsic estimates.
The P/S ratio compares the company’s market value to its revenue, which is often used for businesses that are not currently profitable. For Manchester United, the current 3.5x P/S ratio sits above the US Entertainment industry average of 1.2x and above the peer average of 2.1x, suggesting investors are paying a higher price for each dollar of sales than is typical in this space.
At the same time, the estimated fair P/S ratio for Manchester United is 2.2x, which is also below the current level. That gap points to the market assigning a premium relative to both peers and the fair ratio that regression based models indicate the shares could trade toward if sentiment or expectations shift and points to a level the valuation could move closer to over time.
Explore the SWS fair ratio for Manchester United
Result: Price-to-Sales of 3.5x (OVERVALUED)
However, there are still clear risks, including the current net income loss of £9.064m and a 23.01% three-year total return that lags the recent one-year rebound.
Find out about the key risks to this Manchester United narrative.
Another Take: DCF Points the Other Way
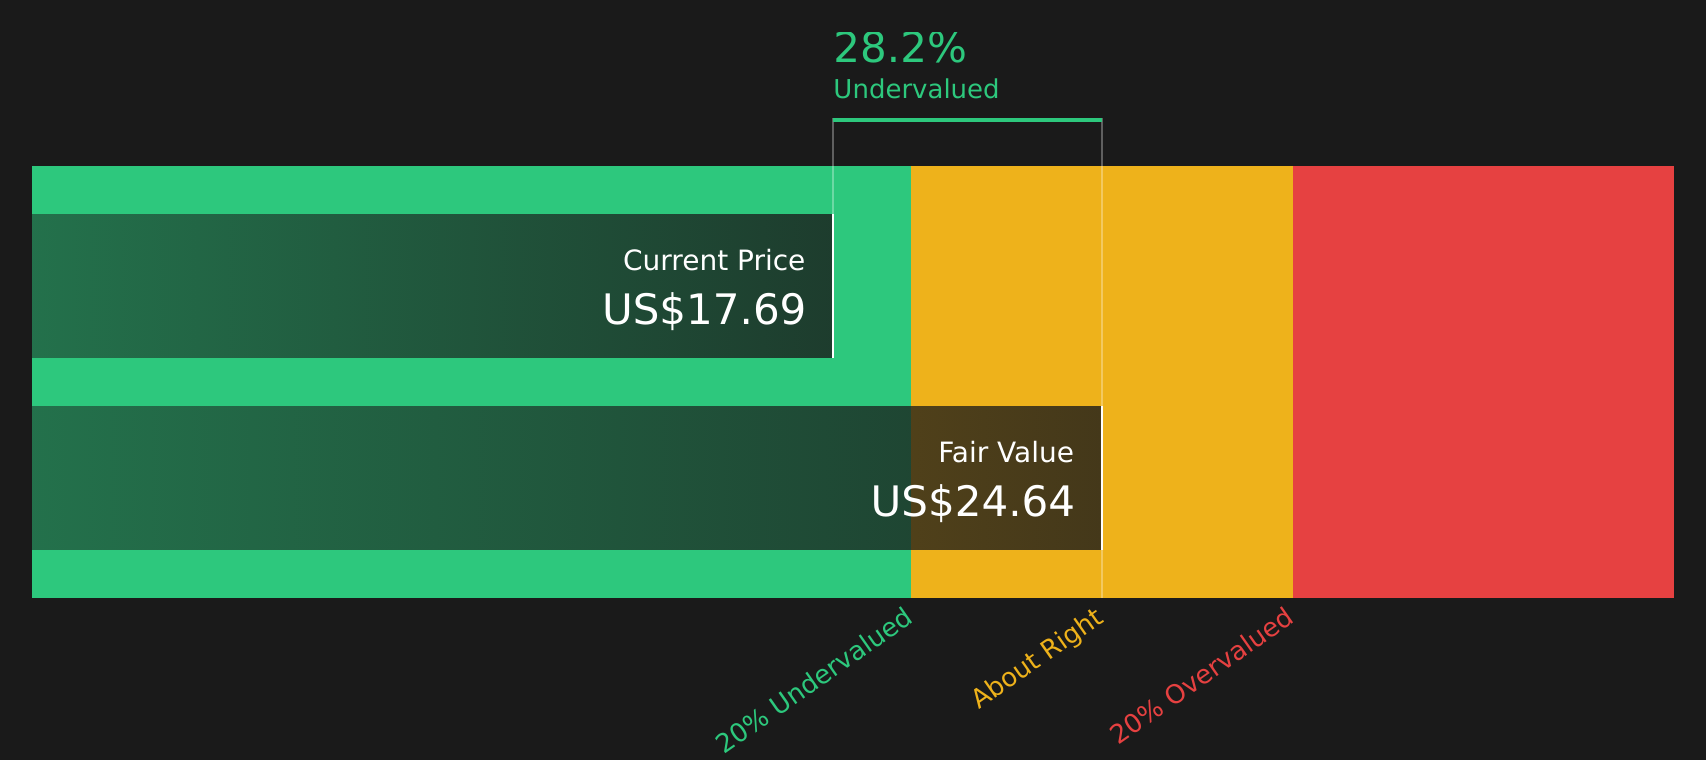
While the 3.5x P/S ratio suggests Manchester United is expensive, the SWS DCF model presents a different perspective. With the share price at $17.47 and an estimated future cash flow value of $24.35, the stock is described as undervalued, which raises a simple question: which signal matters more to you right now?
Look into how the SWS DCF model arrives at its fair value.
Simply Wall St performs a discounted cash flow (DCF) on every stock in the world every day (check out Manchester United for example). We show the entire calculation in full. You can track the result in your watchlist or portfolio and be alerted when this changes, or use our stock screener to discover 61 high quality undervalued stocks. If you save a screener we even alert you when new companies match - so you never miss a potential opportunity.
Next Steps
With mixed signals from valuation and performance so far, it makes sense to look at the underlying data yourself and decide what really matters to you right now, especially as the story includes both concerns and upside potential captured in 3 key rewards and 1 important warning sign.
Looking for more investment ideas?
If Manchester United has caught your attention, do not stop there. Use the Simply Wall St screener to spot fresh ideas that match the kind of opportunities you care about.
- Target potential upside by focusing on companies that combine quality with value using the 61 high quality undervalued stocks.
- Prioritise resilience by scanning for companies with stronger finances through the solid balance sheet and fundamentals stocks screener (40 results).
- Hunt for future standouts before they go mainstream with the screener containing 25 high quality undiscovered gems.
This article by Simply Wall St is general in nature. We provide commentary based on historical data and analyst forecasts only using an unbiased methodology and our articles are not intended to be financial advice. It does not constitute a recommendation to buy or sell any stock, and does not take account of your objectives, or your financial situation. We aim to bring you long-term focused analysis driven by fundamental data. Note that our analysis may not factor in the latest price-sensitive company announcements or qualitative material. Simply Wall St has no position in any stocks mentioned.
Have feedback on this article? Concerned about the content? Get in touch with us directly. Alternatively, email editorial-team@simplywallst.com