


- If you are wondering whether Kosmos Energy offers value at its current share price, it helps to separate short term excitement from what the numbers actually say about the business.
- The stock last closed at US$2.77, with returns of 3.0% over the past week, 8.2% over the past month, 210.3% year to date and 49.7% over the past year. The 3 year and 5 year returns are a 63.5% decline and a 3.5% decline respectively.
- Recent coverage around Kosmos Energy has focused on its share price performance and ongoing position in the oil and gas sector, which has kept investors focused on how current projects and assets are being valued by the market. This backdrop helps explain why short term price moves are drawing attention to whether the current level still reflects the underlying fundamentals.
- On Simply Wall St's valuation checks Kosmos Energy holds a valuation score of 5 out of 6. It therefore makes sense to look at how different valuation methods assess the stock, and then finish with a way of thinking about valuation that goes beyond any single model.
Find out why Kosmos Energy's 49.7% return over the last year is lagging behind its peers.
Approach 1: Kosmos Energy Discounted Cash Flow (DCF) Analysis
A Discounted Cash Flow, or DCF, model estimates what a company might be worth by projecting its future cash flows and then discounting those back to today’s value using an appropriate rate. It is essentially asking what all those future cash flows are worth in today’s dollars.
For Kosmos Energy, the model used is a 2 Stage Free Cash Flow to Equity approach based on cash flow projections. The latest twelve month free cash flow is a loss of $468.55 million, so the model leans heavily on forward estimates. Analyst and extrapolated projections suggest free cash flow reaching $501 million in 2030, with a series of forecasts between 2026 and 2035 that are gradually discounted over time to reflect risk and the time value of money. All cash flows are assessed in US$.
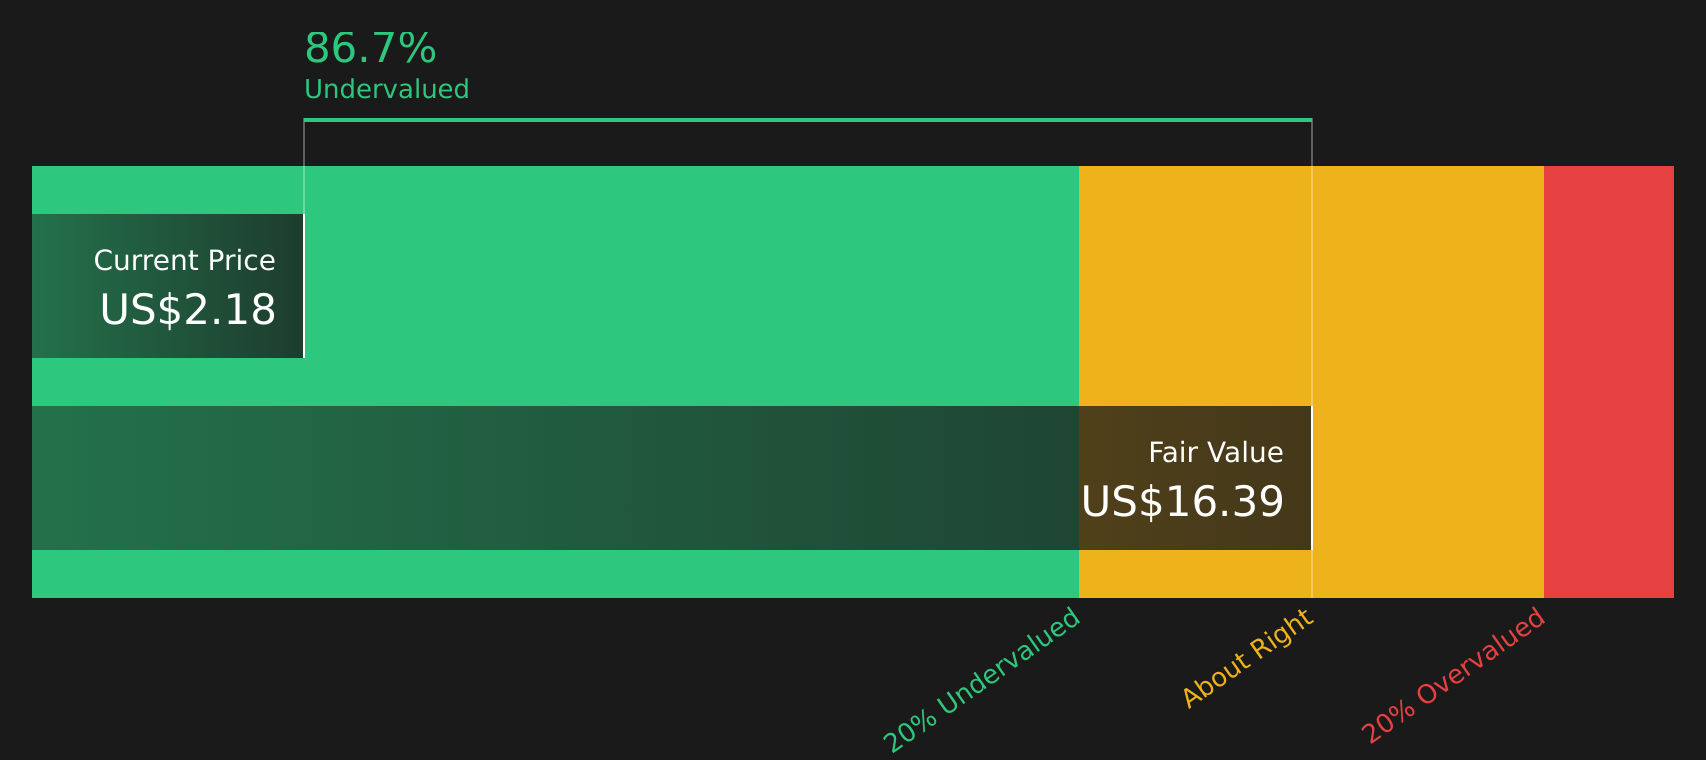
When these projected cash flows are added up and discounted, Simply Wall St’s model arrives at an estimated intrinsic value of $12.72 per share. Against the recent share price of $2.77, this implies the stock is 78.2% undervalued according to this DCF output.
Result: UNDERVALUED
Our Discounted Cash Flow (DCF) analysis suggests Kosmos Energy is undervalued by 78.2%. Track this in your watchlist or portfolio, or discover 64 more high quality undervalued stocks.
Approach 2: Kosmos Energy Price vs Sales
For companies where earnings can be volatile or negative, the P/S ratio is often a useful cross check because it focuses on revenue, which is usually more stable than profits from year to year.
What counts as a "normal" P/S ratio depends on how quickly a company is expected to grow and how risky its cash flows are. Higher expected growth or lower perceived risk can support a higher multiple, while slower growth or higher risk tends to justify a lower one.
Kosmos Energy currently trades on a P/S ratio of 1.27x. This sits below the Oil and Gas industry average P/S of 2.03x and well below the peer group average of 7.07x, which might initially make the shares look inexpensive compared with many peers.
Simply Wall St’s Fair Ratio for Kosmos Energy is 1.32x. This is a proprietary estimate of what the P/S multiple could be given factors such as the company’s earnings profile, industry, profit margins, market cap and specific risks. Because it adjusts for these elements rather than relying only on broad peer or industry comparisons, it can offer a more tailored view of value.
With the Fair Ratio at 1.32x and the current P/S at 1.27x, Kosmos Energy screens as about right on this metric.
Result: ABOUT RIGHT

P/S ratios tell one story, but what if the real opportunity lies elsewhere? Start investing in legacies, not executives. Discover our 19 top founder-led companies.
Upgrade Your Decision Making: Choose your Kosmos Energy Narrative
Earlier it was mentioned that there is an even better way to think about valuation. On Simply Wall St this is done through Narratives, where you set out your story for Kosmos Energy, tie that story to explicit forecasts for revenue, earnings and margins, and arrive at your own Fair Value that you can then compare to the current share price to decide whether the stock looks rich or cheap. The Narrative updates automatically as fresh news or results come in and reflects the wide range of real world views seen today, from one Kosmos Energy Narrative that anchors on a Fair Value of US$4.30 per share to another that anchors on just US$2.00 per share. All of these are accessible in the Community section of the Simply Wall St platform used by millions of investors.
For Kosmos Energy however we will make it really easy for you with previews of two leading Kosmos Energy Narratives:
Here is how a more optimistic, higher fair value angle stacks up against a more cautious, lower fair value view, using the same share price of US$2.77 as a reference point.
Fair Value: US$4.30
Gap to Fair Value: about 35% below this narrative fair value based on the current share price
Revenue Growth Assumption: 10.6% a year
- Focuses on operational outperformance, cost control and expansion in LNG and oil, with analysts in this camp using those factors to support higher margins and free cash flow compared with the current starting point.
- Builds on a view that Kosmos Energy's Atlantic-focused asset base and technology use can support higher realized prices over time, reserve upgrades and a higher valuation anchor.
- Flags real risks around the energy transition, asset concentration, regulation and financing conditions, which could affect production stability, growth plans and profitability if they play out less favorably.
Fair Value: US$2.51
Gap to Fair Value: about 10% above this narrative fair value based on the current share price
Revenue Growth Assumption: 5.8% a year
- Sees LNG growth and oil output supporting cash flow and earnings, but balances that against ongoing impairment risk and a higher discount rate when bringing future cash flows back to today.
- Assumes more modest profit margins and a lower long term profitability profile, alongside a higher implied P/E multiple to justify the fair value used in this narrative.
- Emphasizes exposure to political and regulatory risk in core regions, a meaningful debt load and the pressure from decarbonization policies and alternative energy, all of which could weigh on returns over time.
Taken together, these Narratives bracket a range of fair values and growth paths for Kosmos Energy, and the current price sits between them. The key question for you is which set of assumptions on growth, margins, risk and required return feels more reasonable given your own view of the business and the wider energy sector.
To see how these results tie into long-term growth, risks, and valuation, check out the full range of community narratives for Kosmos Energy on Simply Wall St. Add the company to your watchlist or portfolio so you'll be alerted when the story evolves.
Do you think there's more to the story for Kosmos Energy? Head over to our Community to see what others are saying!

This article by Simply Wall St is general in nature. We provide commentary based on historical data and analyst forecasts only using an unbiased methodology and our articles are not intended to be financial advice. It does not constitute a recommendation to buy or sell any stock, and does not take account of your objectives, or your financial situation. We aim to bring you long-term focused analysis driven by fundamental data. Note that our analysis may not factor in the latest price-sensitive company announcements or qualitative material. Simply Wall St has no position in any stocks mentioned.
Have feedback on this article? Concerned about the content? Get in touch with us directly. Alternatively, email editorial-team@simplywallst.com