


- If you are wondering whether General Motors' recent share price puts it on sale or at a premium, the next sections will help you weigh what you are really paying for each dollar of the business.
- Over the past week the stock returned 5.8%, on a 30 day return of 2.4%, while year to date it sits at a 5.2% decline and the 1 year return stands at 77.2% with a 3 year return of 129.3% and a 5 year return of 36.0%.
- Recent headlines around General Motors have focused on the company’s position in the auto industry, including ongoing scrutiny of how established manufacturers compete against newer players and respond to changing consumer preferences. This context helps frame why investors may be reassessing both the potential and the risks attached to the current share price.
- On Simply Wall St's valuation checks, General Motors scores a 5 out of 6 valuation score, which raises the question of what different valuation methods are signaling today and whether there is an even richer way to interpret that score by the end of this article.
Approach 1: General Motors Discounted Cash Flow (DCF) Analysis
A Discounted Cash Flow, or DCF, model estimates what a company is worth today by projecting its future cash flows and then discounting those back to a present value.
For General Motors, the model uses a 2 Stage Free Cash Flow to Equity approach. The latest twelve month free cash flow stands at about $16.29b, and analysts provide explicit forecasts out to 2027, with Simply Wall St extrapolating further to 2035. For example, projected free cash flow for 2026 is $10.45b and for 2035 it is $12.76b, all in $ terms.
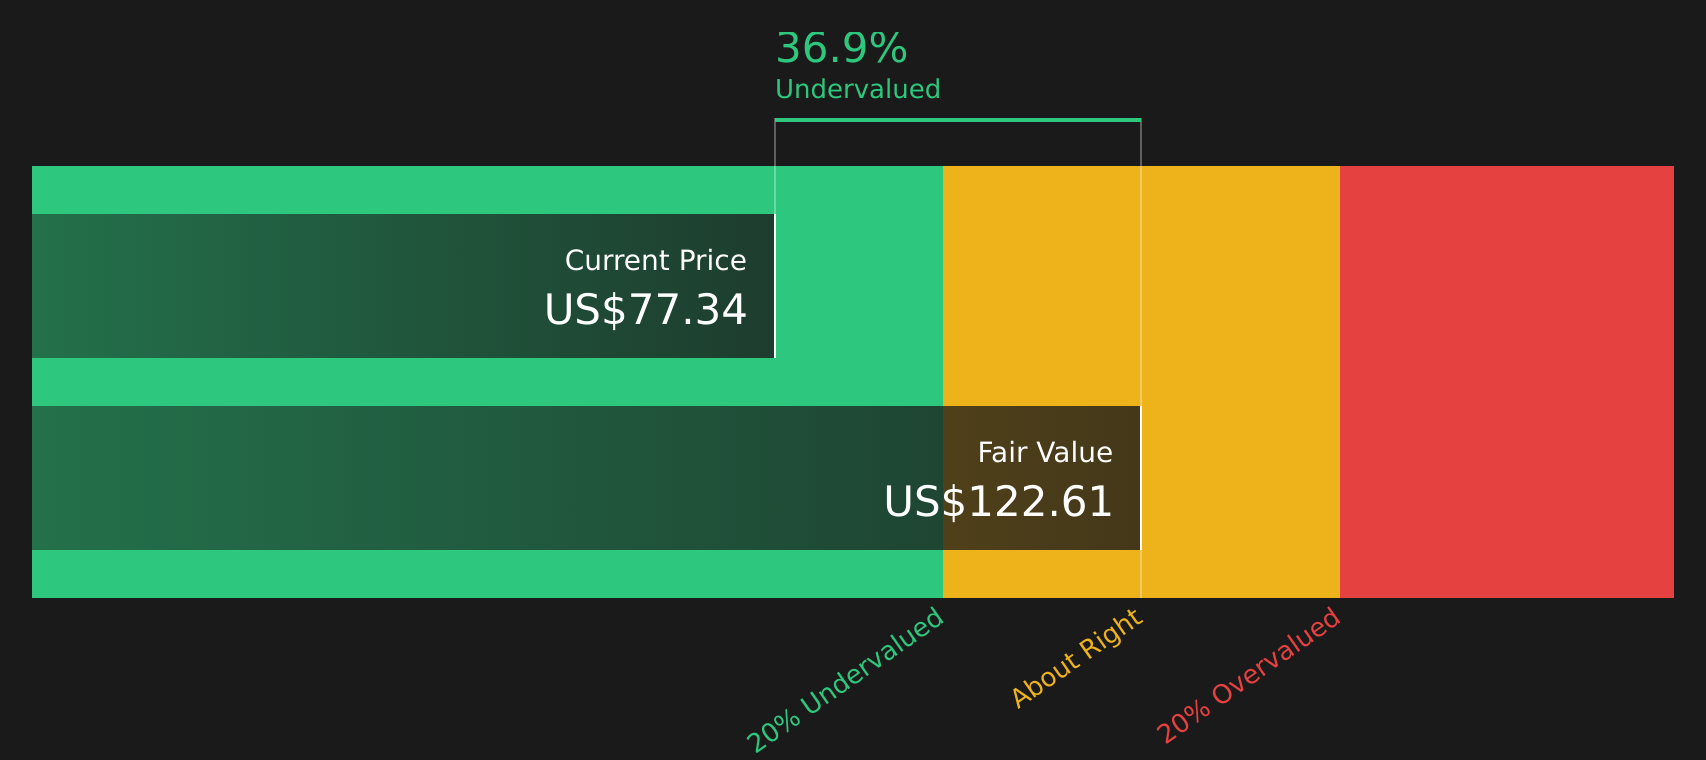
Discounting these cash flows back to today produces an estimated intrinsic value of $120.35 per share. Compared with the current share price, this DCF model indicates the stock is 36.2% undervalued.
For readers, the key takeaway is that under these cash flow assumptions the current price is lower than the modelled value of the underlying business.
Result: UNDERVALUED
Our Discounted Cash Flow (DCF) analysis suggests General Motors is undervalued by 36.2%. Track this in your watchlist or portfolio, or discover 62 more high quality undervalued stocks.
Approach 2: General Motors Price vs Earnings
For profitable companies like General Motors, the P/E ratio is often a useful quick check because it tells you how many dollars you are paying for each dollar of current earnings.
What counts as a “normal” P/E usually reflects how the market views a company’s growth potential and risk. Higher expected growth or lower perceived risk can justify a higher P/E, while slower growth or higher risk tends to come with a lower multiple.
General Motors currently trades on a P/E of 21.8x. That sits above the Auto industry average of 17.1x, but below the peer group average of 56.8x, which suggests investors are pricing it more cautiously than some peers but higher than the broader industry.
Simply Wall St’s “Fair Ratio” is a proprietary P/E estimate that blends factors such as earnings growth, profit margins, industry, market cap and company specific risks into a single number. This gives a more tailored anchor for valuation than a simple comparison with industry averages or peers, which may have very different profiles.
For General Motors, the Fair Ratio is 25.7x, compared with the current P/E of 21.8x, which indicates that the shares are trading below that modelled fair level.
Result: UNDERVALUED

P/E ratios tell one story, but what if the real opportunity lies elsewhere? Start investing in legacies, not executives. Discover our 19 top founder-led companies.
Upgrade Your Decision Making: Choose your General Motors Narrative
Earlier it was mentioned that there is an even better way to understand valuation. Narratives are simply your way of attaching a clear story about General Motors to concrete numbers like fair value, future revenue, earnings and margins, so that your view of the company connects directly to a financial forecast and then to a fair value that can be compared with today’s price.
On Simply Wall St’s Community page, Narratives are an accessible tool used by millions of investors. They allow you to pick or create a storyline, such as a cautious view that ties General Motors to a fair value of about US$41.79 or a more optimistic view that ties it to about US$122.00, and then see how each story translates into different assumptions about growth, profitability and risk.
Once a Narrative is chosen, the platform continuously refreshes it when new information like news or earnings is added. This means you can quickly see whether your chosen fair value still makes sense next to the live share price and use that comparison to decide whether the current price feels attractive, fully valued, or expensive relative to the story you believe.
For General Motors, however, we will make it really easy for you with previews of two leading General Motors Narratives:
The first reflects a more optimistic stance that ties today's share price to higher long term earnings power, while the second leans cautious and assumes the current price is ahead of what the business fundamentals justify.
Use them as two clear reference points and decide which set of assumptions feels closer to your own view of how the company might progress over the next few years.
Fair value: US$79.46 per share
Implied pricing: about 3.4% below this fair value based on the recent close of US$76.73
Revenue growth assumption: 1.24% a year
- Assumes GM's investments in EVs, U.S. manufacturing, and battery capacity support earnings and margins, even with tariff and regulatory headwinds.
- Builds in growing software and services revenue, plus ongoing buybacks and dividends, as key supports for earnings per share.
- Accepts risks from tariffs, EV incentives, warranty costs, competition, and heavy capital spending, but still ties these to a fair value close to where the stock currently trades.
Fair value: US$41.79 per share
Implied pricing: about 83.5% above this fair value based on the recent close of US$76.73
Revenue growth assumption: 1.64% a year
- Assumes GM faces a tough backdrop for manufacturing and operations, which affects how confidently it can commit to its product lineup.
- EV spending is expected to take years to show meaningful returns, with priorities shifting toward stabilising manufacturing and the wider organisation.
- Expects overall revenue to hold up or grow, but with pressure on profit margins and a P/E that lags the rest of the auto industry.
Across the community there are five active Narratives on General Motors, with two leaning toward an undervalued view and three taking a more cautious, overvalued stance. If you want to see how other investors are joining the dots between stories, numbers, and fair values, take a look at the full range of viewpoints for additional context before you decide which story fits your own expectations for the stock.
Do you think there's more to the story for General Motors? Head over to our Community to see what others are saying!

This article by Simply Wall St is general in nature. We provide commentary based on historical data and analyst forecasts only using an unbiased methodology and our articles are not intended to be financial advice. It does not constitute a recommendation to buy or sell any stock, and does not take account of your objectives, or your financial situation. We aim to bring you long-term focused analysis driven by fundamental data. Note that our analysis may not factor in the latest price-sensitive company announcements or qualitative material. Simply Wall St has no position in any stocks mentioned.
Have feedback on this article? Concerned about the content? Get in touch with us directly. Alternatively, email editorial-team@simplywallst.com