


Over the last 7 days, the United States market has risen by 3.4%, contributing to a remarkable 30% increase over the past year, with earnings forecasted to grow by 16% annually. In such an environment, identifying stocks that are potentially undervalued can offer investors opportunities to capitalize on discrepancies between current prices and intrinsic value.
Top 10 Undervalued Stocks Based On Cash Flows In The United States
| Name | Current Price | Fair Value (Est) | Discount (Est) |
| Zeta Global Holdings (ZETA) | $15.32 | $30.30 | 49.4% |
| National Bank Holdings (NBHC) | $42.02 | $81.90 | 48.7% |
| Ferroglobe (GSM) | $4.23 | $8.46 | 50% |
| DNOW (DNOW) | $12.25 | $23.80 | 48.5% |
| Crexendo (CXDO) | $6.10 | $12.06 | 49.4% |
| Coastal Financial (CCB) | $82.72 | $161.95 | 48.9% |
| BillionToOne (BLLN) | $82.50 | $164.18 | 49.8% |
| Ategrity Specialty Insurance Company Holdings (ASIC) | $21.04 | $41.25 | 49% |
| Alkami Technology (ALKT) | $15.67 | $30.70 | 49% |
| Aldeyra Therapeutics (ALDX) | $1.59 | $3.10 | 48.7% |
Let's explore several standout options from the results in the screener.
Kimberly-Clark (KMB)
Overview: Kimberly-Clark Corporation, along with its subsidiaries, manufactures and markets personal care products in the United States and has a market cap of approximately $32.20 billion.
Operations: The company's revenue is primarily derived from its North America segment, generating $10.75 billion, and the International Personal Care segment, contributing $5.69 billion.
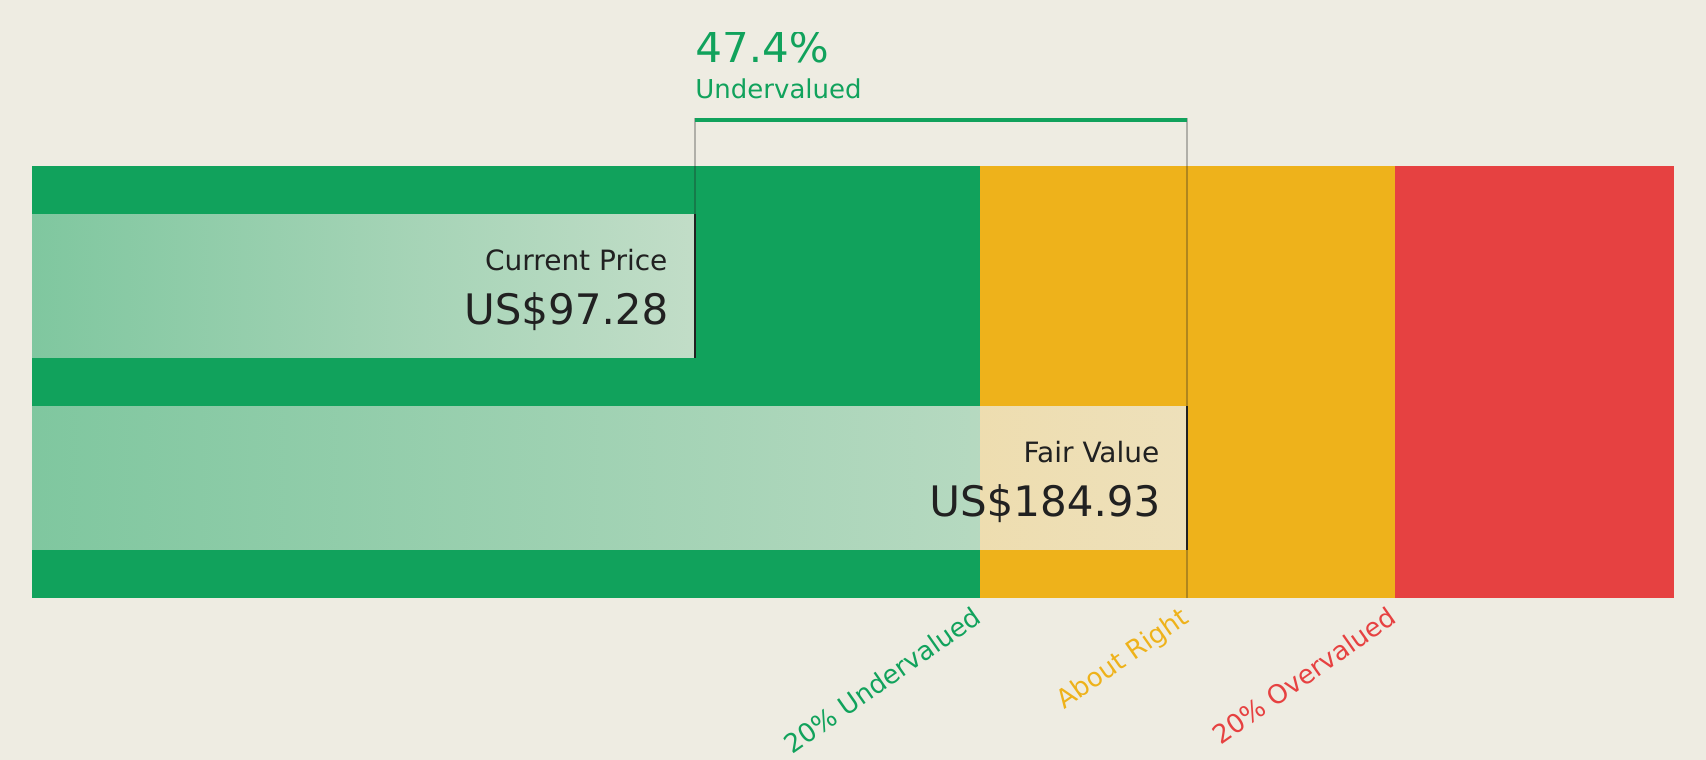
Estimated Discount To Fair Value: 47%
Kimberly-Clark is trading at US$97.96, significantly below its estimated future cash flow value of US$184.93, suggesting it is undervalued based on discounted cash flows. Despite high debt levels and a dividend yield of 5.23% that isn't well covered by earnings or free cash flows, the company is expected to achieve significant annual earnings growth of 25.4%, outpacing the broader U.S. market's growth rate.
- Our growth report here indicates Kimberly-Clark may be poised for an improving outlook.
- Unlock comprehensive insights into our analysis of Kimberly-Clark stock in this financial health report.
Generac Holdings (GNRC)
Overview: Generac Holdings Inc. designs, manufactures, and distributes energy technology products and solutions worldwide with a market cap of approximately $11.91 billion.
Operations: The company generates revenue primarily through its electric equipment segment, which accounts for $4.21 billion.
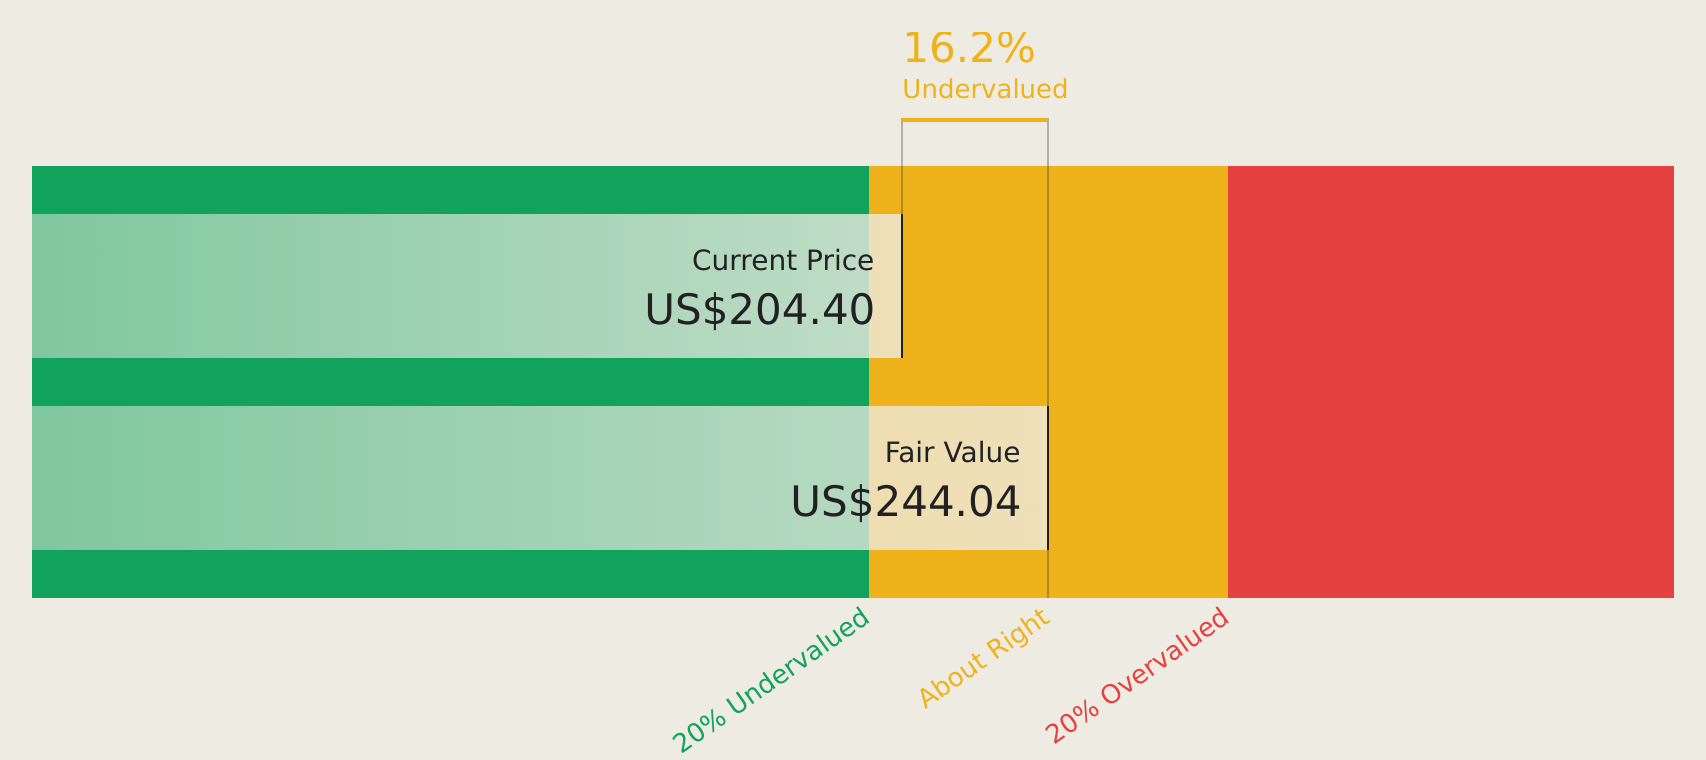
Estimated Discount To Fair Value: 17.1%
Generac Holdings, trading at US$207.34, is undervalued compared to its estimated future cash flow value of US$250.03. Despite a recent drop in profit margins and earnings, the company forecasts significant annual earnings growth of 26.3%, outpacing the U.S. market's growth rate. Recent strategic alliances and product launches aim to enhance resilience and efficiency in energy solutions, potentially boosting future cash flows despite current challenges with lower net income margins and sales declines from previous years.
- Our comprehensive growth report raises the possibility that Generac Holdings is poised for substantial financial growth.
- Click here and access our complete balance sheet health report to understand the dynamics of Generac Holdings.
On Holding (ONON)
Overview: On Holding AG, with a market cap of $11.19 billion, develops and distributes performance sports products under the On brand across Switzerland, Europe, the Middle East, Africa, the United States, other parts of the Americas, and Asia-Pacific.
Operations: The company's revenue primarily comes from its Athletic Footwear segment, which generated CHF 3.01 billion.
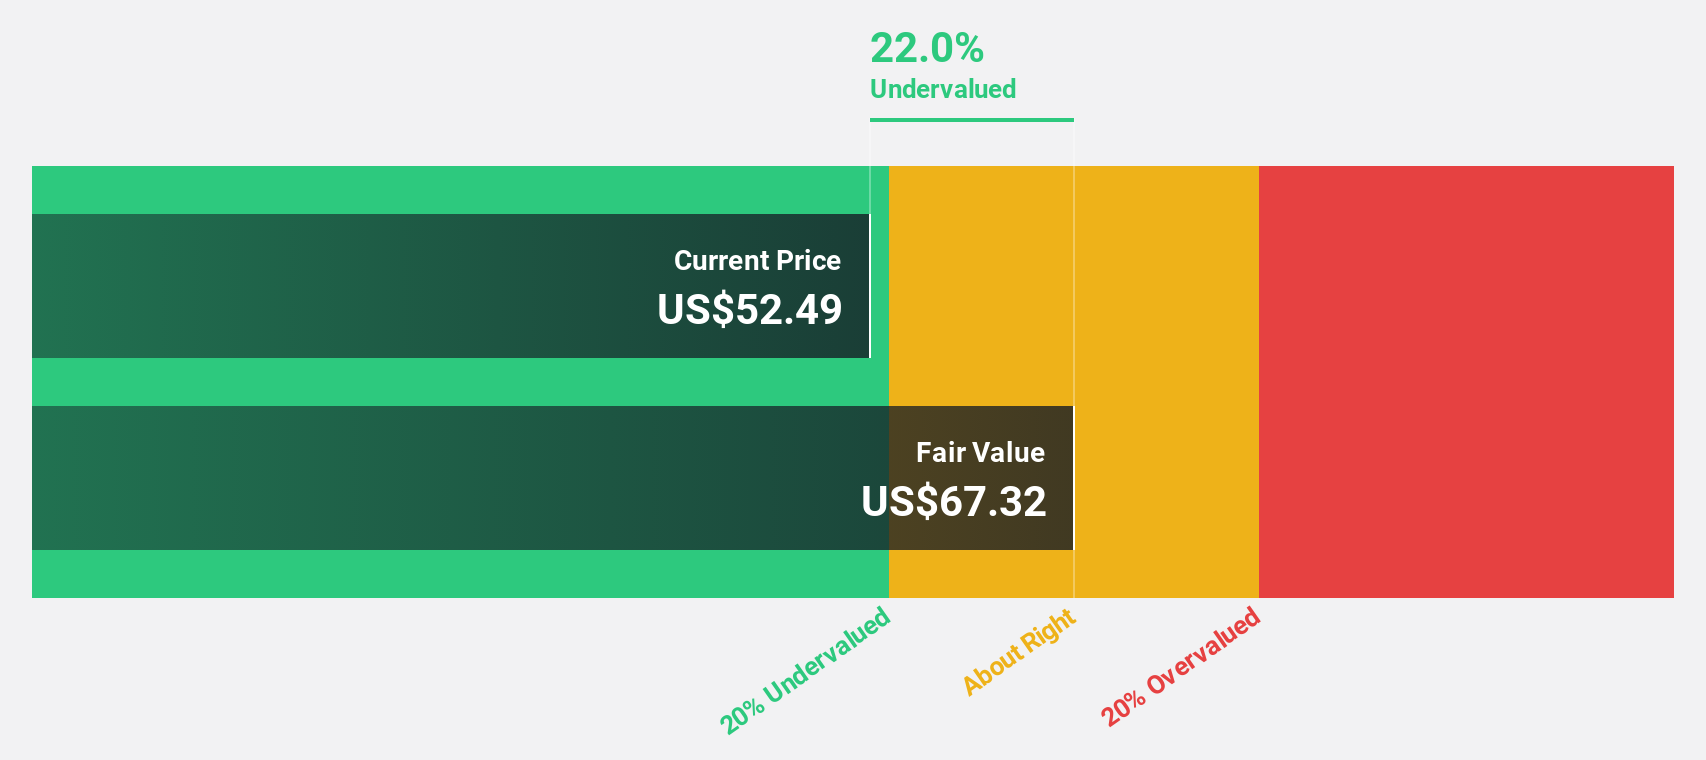
Estimated Discount To Fair Value: 14.7%
On Holding, trading at US$34.44, is undervalued relative to its estimated future cash flow value of US$40.36. While profit margins have decreased from 10.5% to 6.8%, the company forecasts significant annual earnings growth of 24.54%, surpassing U.S. market averages and indicating robust potential for future cash flows despite current margin challenges and a recent executive transition aimed at sustaining strategic growth initiatives and operational agility.
- Our earnings growth report unveils the potential for significant increases in On Holding's future results.
- Take a closer look at On Holding's balance sheet health here in our report.
Seize The Opportunity
- Unlock more gems! Our Undervalued US Stocks Based On Cash Flows screener has unearthed 151 more companies for you to explore.Click here to unveil our expertly curated list of 154 Undervalued US Stocks Based On Cash Flows.
- Already own these companies? Link your portfolio to Simply Wall St and get alerts on any new warning signs to your stocks.
- Simply Wall St is a revolutionary app designed for long-term stock investors, it's free and covers every market in the world.
Want To Explore Some Alternatives?
- Explore high-performing small cap companies that haven't yet garnered significant analyst attention.
- Diversify your portfolio with solid dividend payers offering reliable income streams to weather potential market turbulence.
- Fuel your portfolio with companies showing strong growth potential, backed by optimistic outlooks both from analysts and management.
This article by Simply Wall St is general in nature. We provide commentary based on historical data and analyst forecasts only using an unbiased methodology and our articles are not intended to be financial advice. It does not constitute a recommendation to buy or sell any stock, and does not take account of your objectives, or your financial situation. We aim to bring you long-term focused analysis driven by fundamental data. Note that our analysis may not factor in the latest price-sensitive company announcements or qualitative material. Simply Wall St has no position in any stocks mentioned.
Have feedback on this article? Concerned about the content? Get in touch with us directly. Alternatively, email editorial-team@simplywallst.com