


- If you are wondering whether Privia Health Group at around US$22.71 is offering fair value or a potential mispricing opportunity, this breakdown will help you make sense of the current share price.
- The stock has moved 7.1% over the last 7 days and 1.1% over the past month, while the year-to-date return of 3.2% and 1-year return of 4.0% show a very different picture when you zoom out.
- Recent attention on Privia Health Group has centered on its role within the US healthcare sector and how its business model fits into ongoing shifts in medical practice management and patient care. This has kept investors focused on how much growth is already reflected in the share price versus what is still being priced in as uncertainty.
- Right now, Privia Health Group scores a 3 out of 6 on our valuation checks. The next sections will walk through different ways of assessing that score and finish with a broader framework that can help you judge value more confidently.
Approach 1: Privia Health Group Discounted Cash Flow (DCF) Analysis
A Discounted Cash Flow, or DCF, model estimates what a company might be worth by projecting its future cash flows and then discounting them back to today’s dollars. It is essentially asking what all those future cash flows are worth to you right now.
For Privia Health Group, the model uses a 2 Stage Free Cash Flow to Equity approach. The latest twelve month Free Cash Flow stands at about $163.4 million. Analysts provide forecasts out to 2030, with projected Free Cash Flow of $204 million in that year. Beyond the near term, Simply Wall St extrapolates additional annual Free Cash Flow figures through to 2035 using its own growth assumptions.
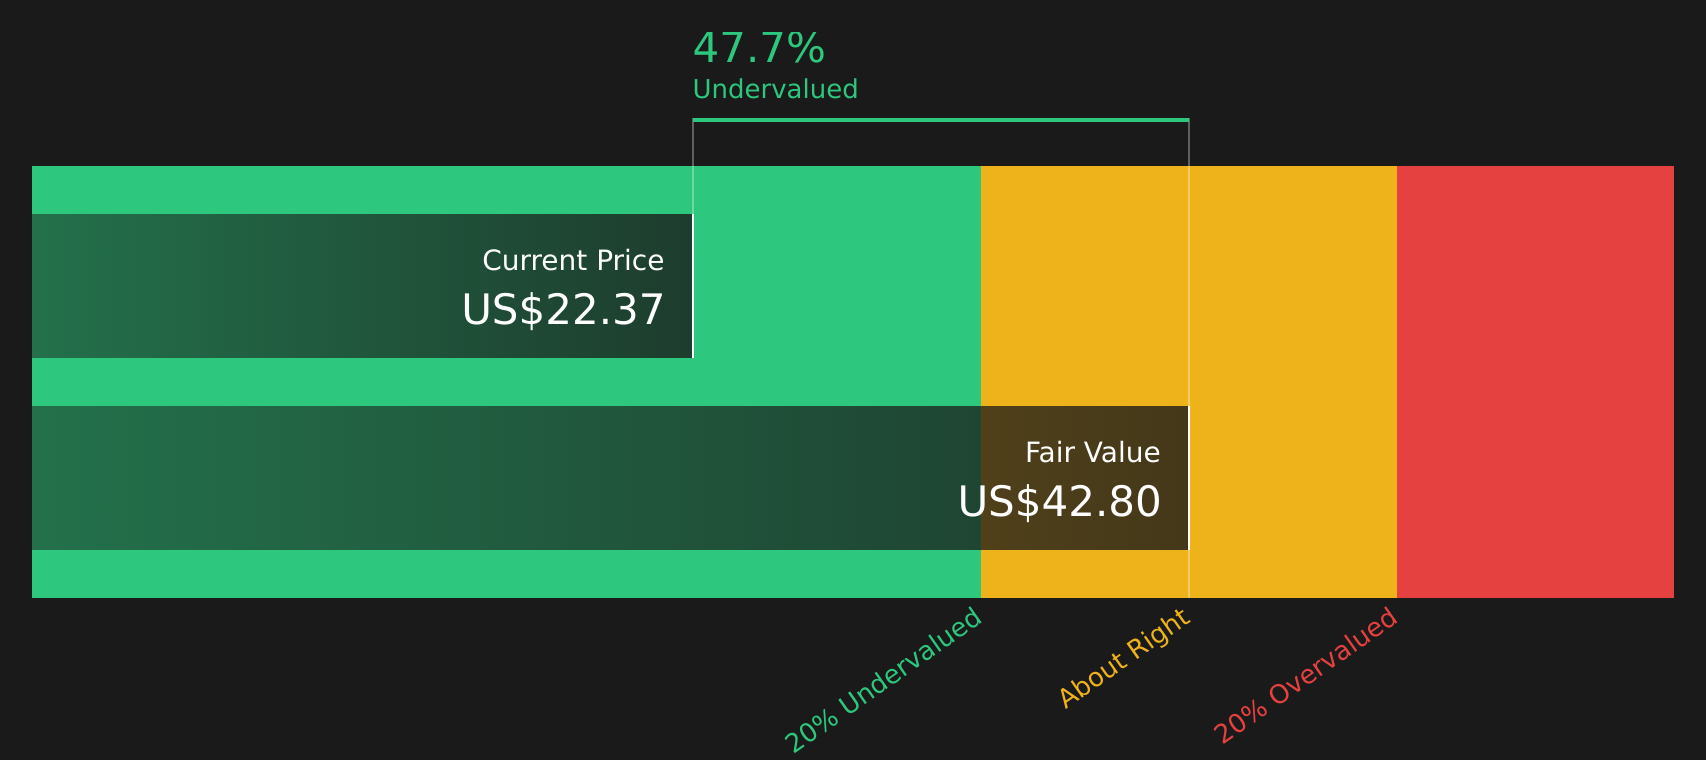
When all of those projected cash flows are discounted back and added together, the model arrives at an intrinsic value of about $42.80 per share. Against a current share price of around $22.71, this implies the stock is 46.9% undervalued based on this DCF framework.
Result: UNDERVALUED
Our Discounted Cash Flow (DCF) analysis suggests Privia Health Group is undervalued by 46.9%. Track this in your watchlist or portfolio, or discover 62 more high quality undervalued stocks.
Approach 2: Privia Health Group Price vs Earnings
For profitable companies, the P/E ratio is a useful way to think about value because it links what you pay for each share to the earnings that the business is currently generating. Investors usually expect faster growing and lower risk businesses to trade on higher P/E ratios, while slower growth or higher risk companies often sit on lower P/E levels.
Privia Health Group currently trades on a P/E of 124.48x. That stands well above the Healthcare industry average P/E of 22.60x and also above the peer group average of 29.56x. Simply Wall St’s Fair Ratio framework estimates what a more suitable P/E might be, given factors such as earnings growth, industry, profit margins, market cap and risk, and arrives at a Fair Ratio of 28.57x for Privia Health Group.
This Fair Ratio can be more helpful than a simple comparison with peers or the sector because it adjusts for the company’s specific characteristics rather than assuming that all Healthcare stocks should trade on the same multiple. Compared with the current P/E of 124.48x, the Fair Ratio of 28.57x suggests the shares are pricing in much richer expectations than this model implies.
Result: OVERVALUED

P/E ratios tell one story, but what if the real opportunity lies elsewhere? Start investing in legacies, not executives. Discover our 19 top founder-led companies.
Upgrade Your Decision Making: Choose your Privia Health Group Narrative
Earlier the article mentioned that there is an even better way to understand valuation, so this is where Narratives come in, giving you a simple story that connects your view on Privia Health Group to the numbers you think are realistic for its future revenue, earnings and margins, then linking that forecast to a Fair Value you can compare with the current share price to decide whether the stock looks attractive or stretched.
On Simply Wall St’s Community page, Narratives are easy to set up and use. They are available to millions of investors who want to move beyond headline P/E ratios and instead anchor decisions to a clear, transparent framework that ties the company’s business model and risks to a set of assumptions and a resulting valuation.
Because Narratives are refreshed when new information comes in, such as earnings updates or news on issues like payor consolidation, regulation or technology adoption, your Fair Value view can adjust without needing to rebuild a full model each time something changes.
For Privia Health Group, one investor might build a Narrative that leans closer to the higher analyst earnings and price target assumptions around US$130.3m in 2029 earnings and a US$40.00 fair value, while another might align with the more cautious end, closer to US$75.0m in earnings and a US$25.00 fair value. Both can clearly see how their different stories lead to different Fair Values and choices.
Do you think there's more to the story for Privia Health Group? Head over to our Community to see what others are saying!

This article by Simply Wall St is general in nature. We provide commentary based on historical data and analyst forecasts only using an unbiased methodology and our articles are not intended to be financial advice. It does not constitute a recommendation to buy or sell any stock, and does not take account of your objectives, or your financial situation. We aim to bring you long-term focused analysis driven by fundamental data. Note that our analysis may not factor in the latest price-sensitive company announcements or qualitative material. Simply Wall St has no position in any stocks mentioned.
Have feedback on this article? Concerned about the content? Get in touch with us directly. Alternatively, email editorial-team@simplywallst.com