


- If you are trying to figure out whether Carvana's current share price lines up with its underlying worth, you are in the right place for a closer look at what the market might be pricing in.
- Carvana's share price closed at US$326.93 recently, with returns of 4.1% over the past week, 2.6% over the past month, an 18.3% decline year to date, and 60.5% over the last year, while the 3 year return is very large and the 5 year return is 16.1%.
- Recent headlines around Carvana have focused on its sharp share price swings and ongoing debates about the resilience of its online used car model. These have kept sentiment closely tied to shifting expectations. Broader sector news around used car demand, financing conditions and consumer confidence has also framed how investors interpret each move in the stock.
- Carvana currently holds a 3/6 valuation score. Next up is a look at how different valuation methods line up on the stock, followed by a simple framework at the end of this article that can help you judge whether those valuation results really fit your own view.
Approach 1: Carvana Discounted Cash Flow (DCF) Analysis
A Discounted Cash Flow model estimates what a business could be worth by projecting its future cash flows and discounting them back to today, so you can compare that value with the current share price.
For Carvana, the model uses a 2 Stage Free Cash Flow to Equity approach based on cash flow projections. The latest twelve month free cash flow stands at about $888.5 million. Analysts provide estimates out to 2030, with projected free cash flow of $4.26b in that year. Between 2026 and 2035, ten year projections are used, with the later years extrapolated by Simply Wall St rather than based on direct analyst coverage.
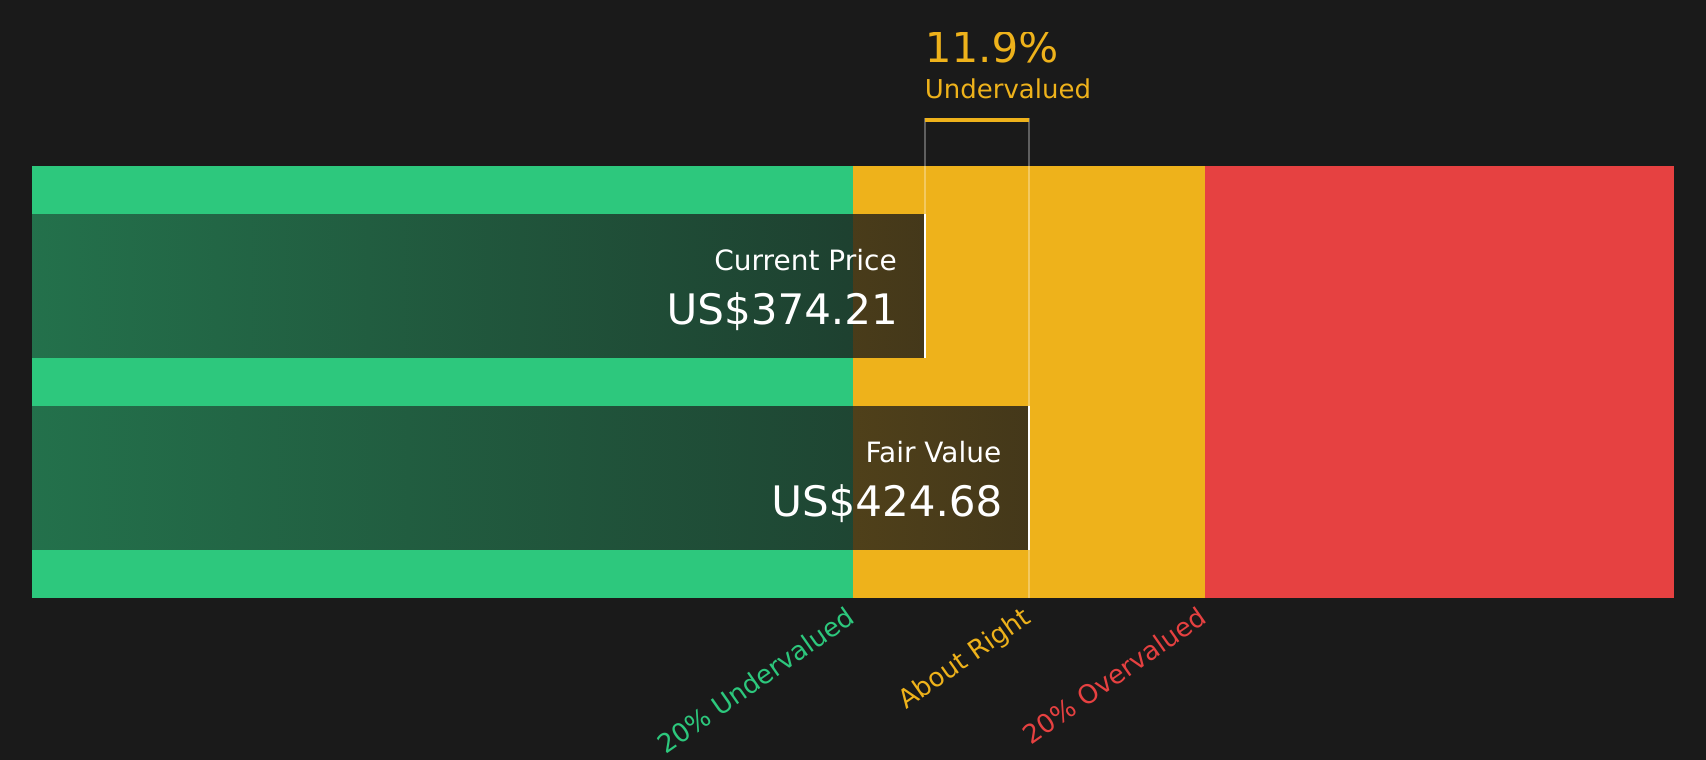
Combining these forecasts, the DCF model points to an estimated intrinsic value of about US$426.88 per share. Compared with the recent share price of US$326.93, this implies the stock trades at roughly a 23.4% discount to that DCF estimate, which signals undervaluation on this framework.
Result: UNDERVALUED
Our Discounted Cash Flow (DCF) analysis suggests Carvana is undervalued by 23.4%. Track this in your watchlist or portfolio, or discover 62 more high quality undervalued stocks.
Approach 2: Carvana Price vs Earnings
P/E is a common way to value profitable companies because it ties the share price directly to the earnings that support it. In simple terms, it shows how many dollars investors are currently willing to pay for each dollar of earnings.
What counts as a "normal" P/E will usually reflect expectations for future earnings growth and the perceived risk of those earnings. Higher growth and lower risk can support a higher P/E, while slower growth or higher risk will usually line up with a lower multiple.
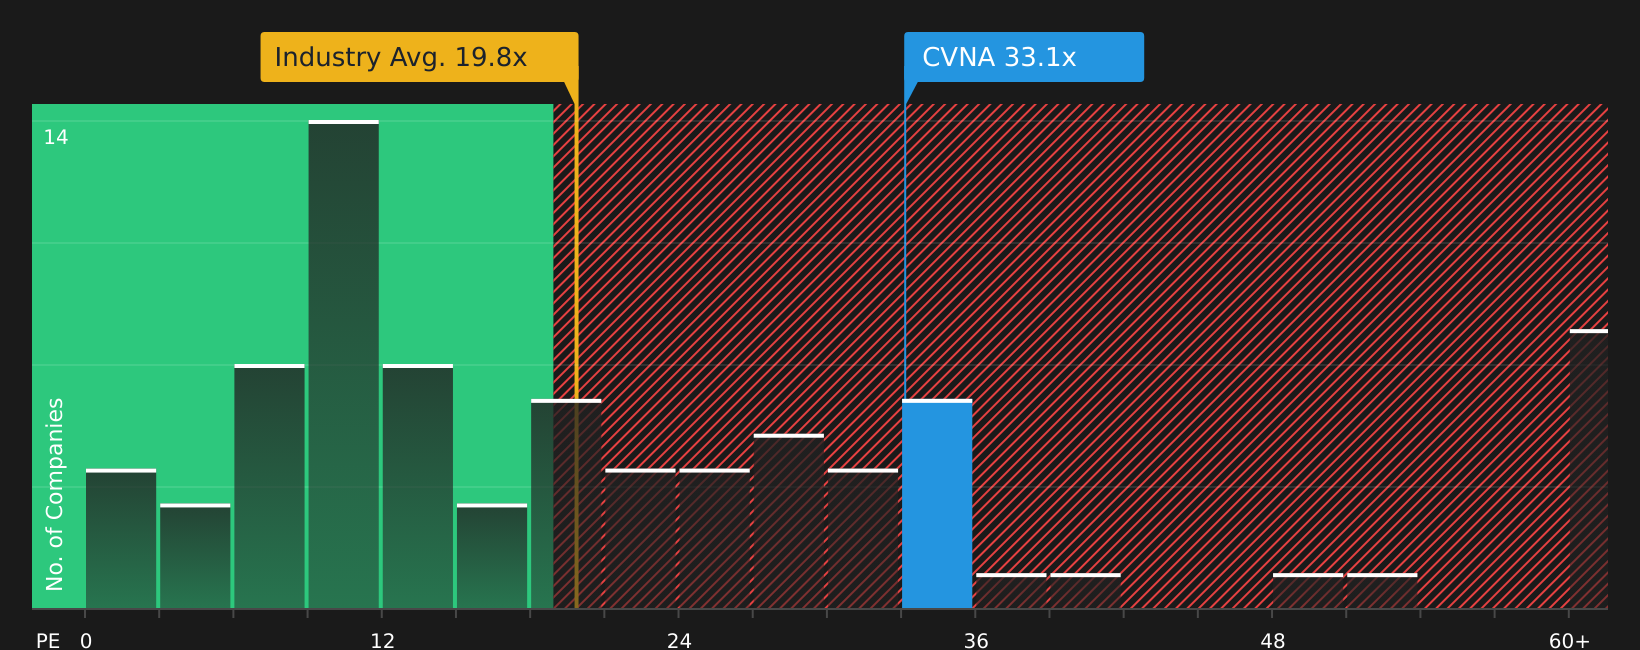
Carvana trades on a P/E of 33.23x. That sits above the Specialty Retail industry average of 19.51x and also above the peer group average of 21.36x, which suggests the market is currently assigning a richer multiple than many sector comparables.
Simply Wall St’s Fair Ratio for Carvana is 29.50x. This is a proprietary estimate of what P/E might be reasonable given factors such as the company’s earnings growth profile, industry, profit margins, market cap and risk characteristics.
Because the Fair Ratio adjusts for those fundamentals instead of just comparing with raw industry or peer averages, it can provide a more tailored reference point for the stock’s valuation.
Comparing the current P/E of 33.23x with the Fair Ratio of 29.50x indicates that Carvana is trading above that fair multiple. On this metric, the shares appear overvalued.
Result: OVERVALUED
P/E ratios tell one story, but what if the real opportunity lies elsewhere? Start investing in legacies, not executives. Discover our 19 top founder-led companies.
Upgrade Your Decision Making: Choose your Carvana Narrative
Earlier it was mentioned that there is an even better way to think about valuation, so consider Narratives, where you spell out your story about Carvana, connect that story to concrete assumptions for future revenue, earnings and margins, and the platform turns those inputs into a Fair Value that you can compare with the current price. You can track this easily on Simply Wall St’s Community page and see it update automatically as new news or earnings arrive. This applies whether your view is closer to a very cautious stance that focuses on concerns about financial stability and a Fair Value near US$0, or a much more optimistic view that ties Carvana’s potential to a Fair Value of about US$519, with both ends of that range showing how two investors looking at the same stock can reach very different but clearly quantified conclusions.
For Carvana however we will make it really easy for you with previews of two leading Carvana Narratives:
These sit at opposite ends of the current debate, so you can quickly see what assumptions need to be true for each story to make sense at today’s share price of US$326.93.
Fair value: US$519.00
Implied undervaluation vs last close: 36.9%
Revenue growth assumption: 33.41%
- Expects Carvana to benefit from scale efficiencies, ADESA integration and AI enabled automation that together improve unit economics and operating leverage over time.
- Builds on analyst assumptions for revenue growth in the low 30% range and rising profit margins, with earnings moving higher over the next few years if execution supports volume and cost control.
- Uses a Fair Value of US$519.00 and a future P/E in the high 20s, with the current price sitting below that level, so you would need to be comfortable with strong revenue and earnings expansion to back this view.
Fair value: US$0.00
Implied overvaluation vs last close: very large
Revenue growth assumption: 100%
- Raises concerns about Carvana’s history of negative cash flow alongside debt growth, and questions whether reported profitability reflects sustainable operations or accounting adjustments.
- Highlights reliance on securitizing subprime auto loans, which some observers see as adding opacity around asset quality, especially when used car loan delinquencies are rising.
- Points to past regulatory and legal scrutiny, including license issues and short seller allegations, as reasons some investors assign a Fair Value of US$0.00 and view the current share price as far above what they regard as justified.
These two narratives frame the current range of opinions on Carvana, from a bullish focus on scaling and digital advantages to a cautious focus on balance sheet risk and accounting quality. The key for you is to decide which assumptions feel more realistic and how that aligns with your own tolerance for risk.
To see how these results tie into long-term growth, risks, and valuation, check out the full range of community narratives for Carvana on Simply Wall St. Add the company to your watchlist or portfolio so you'll be alerted when the story evolves.
Do you think there's more to the story for Carvana? Head over to our Community to see what others are saying!

This article by Simply Wall St is general in nature. We provide commentary based on historical data and analyst forecasts only using an unbiased methodology and our articles are not intended to be financial advice. It does not constitute a recommendation to buy or sell any stock, and does not take account of your objectives, or your financial situation. We aim to bring you long-term focused analysis driven by fundamental data. Note that our analysis may not factor in the latest price-sensitive company announcements or qualitative material. Simply Wall St has no position in any stocks mentioned.
Have feedback on this article? Concerned about the content? Get in touch with us directly. Alternatively, email editorial-team@simplywallst.com