


- If you are wondering whether Fortinet at around US$76.70 still offers value after a weak share price patch, this article walks through what the current market price might be implying about the stock.
- The share price is around US$76.70 after a 7.1% decline over the last week, a 9.1% decline over the last month, and a 21.5% decline over the last year, while the 3 year and 5 year returns sit at 12.7% and 86.2% respectively.
- Recent headlines have focused on Fortinet's role as a major cybersecurity vendor in a sector that often reacts sharply to changing sentiment about IT spending and security budgets. These shifts in focus can influence how investors view both the risks around future demand and the price they are willing to pay today.
- Fortinet currently has a valuation score of 3/6. The next sections will unpack what different valuation methods say about that score, before finishing with a broader framework that can help you judge whether those numbers really fit your own view of the company.
Find out why Fortinet's -21.5% return over the last year is lagging behind its peers.
Approach 1: Fortinet Discounted Cash Flow (DCF) Analysis
A Discounted Cash Flow model takes estimates of a company’s future cash flows, then discounts those back into today’s dollars to arrive at an estimate of what the entire business might be worth per share.
For Fortinet, the model uses a 2 Stage Free Cash Flow to Equity approach based on cash flow projections. The latest twelve month Free Cash Flow is about $2.23b, and analysts and extrapolated estimates project Free Cash Flow reaching about $3.98b by 2030. Simply Wall St uses analyst inputs where available, then extends the series to produce a full ten year path of Free Cash Flow in dollars.
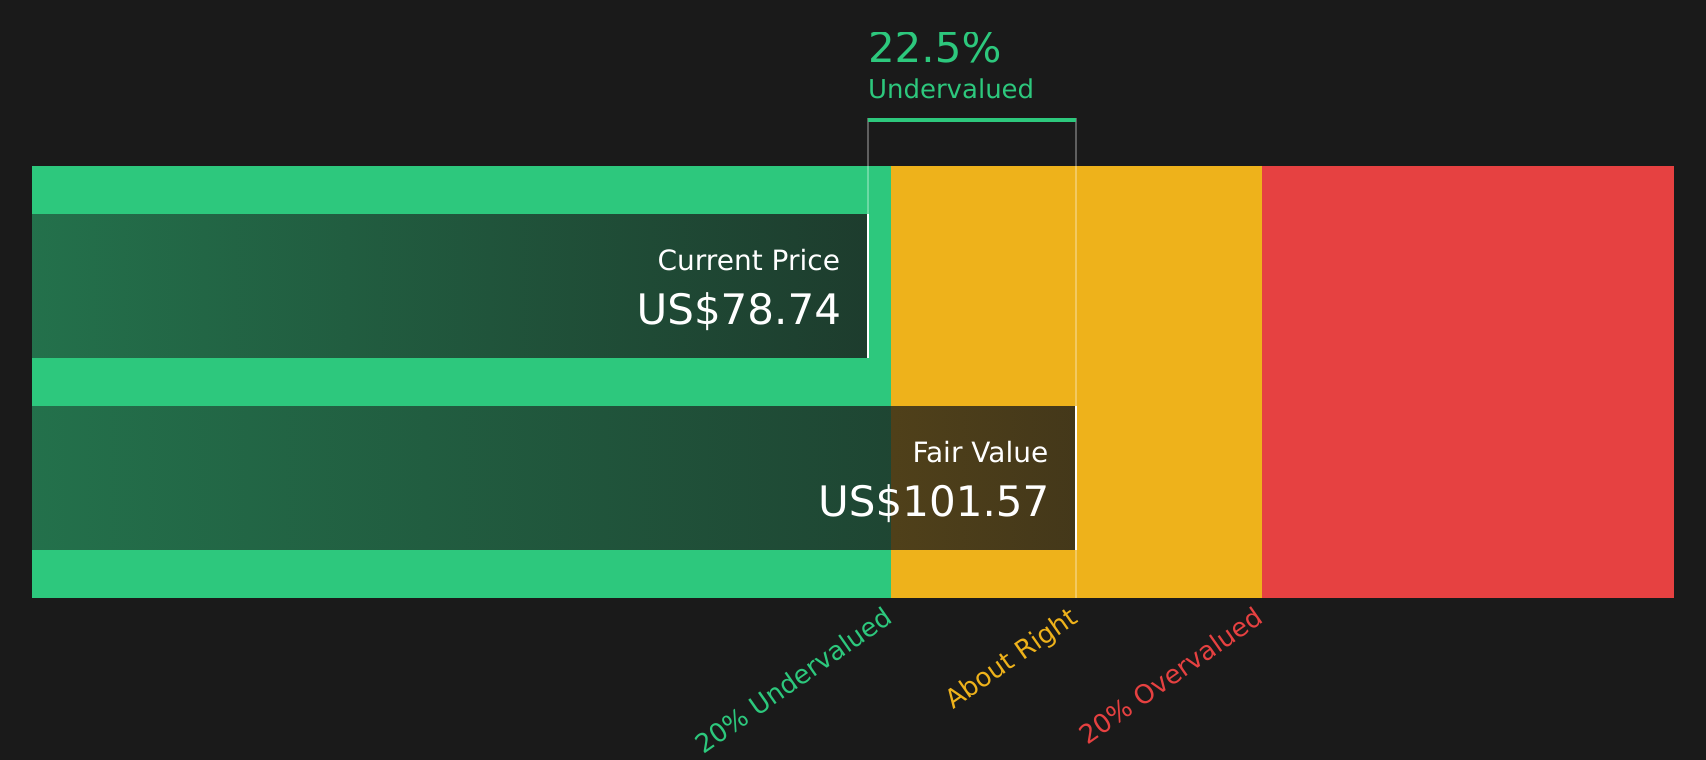
Based on these assumptions, the DCF output suggests an intrinsic value of about $101.57 per share, compared with a current share price around $76.70. That gap equates to an implied discount of roughly 24.5%. In other words, this model indicates that the shares are trading below the estimated value implied by the projected cash generation.
Result: UNDERVALUED
Our Discounted Cash Flow (DCF) analysis suggests Fortinet is undervalued by 24.5%. Track this in your watchlist or portfolio, or discover 58 more high quality undervalued stocks.
Approach 2: Fortinet Price vs Earnings
For profitable companies, the P/E ratio is a useful yardstick because it links what you pay per share to the earnings that each share currently generates. It gives you a quick sense of how many years of current earnings the market is pricing in.
What counts as a “normal” P/E depends on how the market views a company’s growth prospects and risk profile. Higher expected growth or lower perceived risk can justify a higher P/E, while slower growth or higher risk usually calls for a lower one.
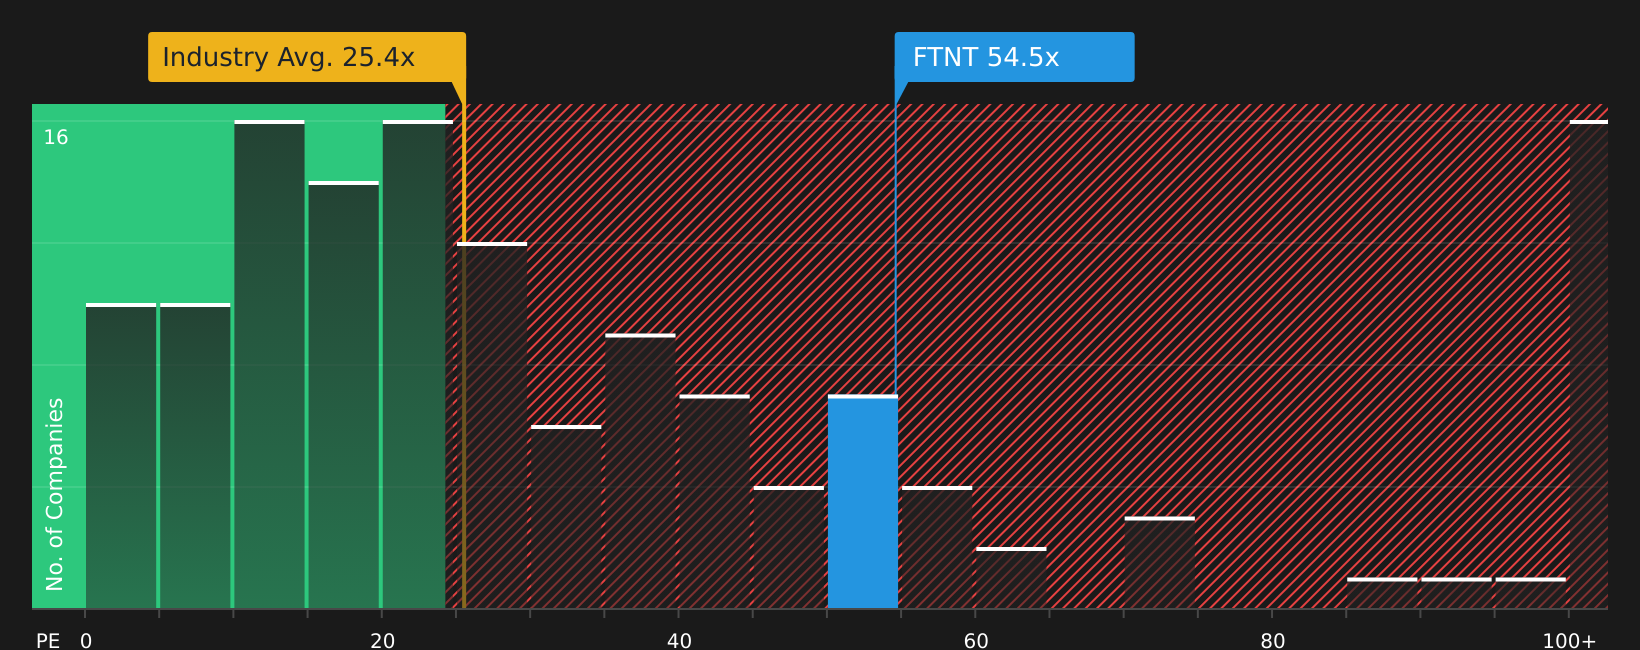
Fortinet currently trades on a P/E of about 30.6x, compared with the Software industry average of roughly 26.9x and a peer group average of about 44.8x. Simply Wall St’s proprietary “Fair Ratio” for Fortinet is around 30.6x, which reflects factors such as its earnings growth profile, margins, industry, market cap and company specific risks.
That Fair Ratio can be more informative than a simple peer or industry comparison because it adjusts the benchmark to Fortinet’s own characteristics rather than assuming that every Software company should trade at the same multiple. Since the Fair Ratio and the current P/E are almost identical, the P/E suggests the shares are priced close to what this model views as reasonable.
Result: ABOUT RIGHT
P/E ratios tell one story, but what if the real opportunity lies elsewhere? Start investing in legacies, not executives. Discover our 18 top founder-led companies.
Upgrade Your Decision Making: Choose your Fortinet Narrative
Earlier it was mentioned that there is an even better way to think about valuation, and on Simply Wall St that takes the form of Narratives. In a Narrative, you set out your story for Fortinet, link it to specific assumptions about future revenue, earnings, margins and fair value, then compare that fair value with the current price to judge whether the stock looks attractive or stretched.
A Narrative is essentially your written view of the business joined directly to a forecast. Instead of just accepting a single target price, you choose numbers that fit the story you believe, such as a more cautious fair value around US$68 with revenue growth of about 9.3% and a P/E of 25.3x, or a more optimistic fair value near US$110 with revenue growth of roughly 15.2% and a P/E of 38.2x, or something closer to the consensus fair value of about US$87 to US$90 that sits in the middle.
On the Simply Wall St Community page, Narratives are easy to use and update automatically when new news or earnings data arrives. You can see in real time how different Fortinet stories, ranging from bearish to bullish, translate into changing fair value ranges and how those compare to the current share price.
For Fortinet, however, we will make it really easy for you with previews of two leading Fortinet Narratives:
Fair value in this bullish Narrative: about US$99.03 per share.
Implied discount vs last close around US$76.70: roughly 22.6%.
Revenue growth assumption: 12%.
- Emphasises Fortinet's GAAP profitability, with operating and net margins around 30% supported by an organic growth model rather than large acquisitions.
- Highlights a TTM P/E of about 40x that is much lower than the 10 year historical average P/E of 140x, framing the current valuation as more reasonable relative to the company’s own history.
- Sees the thesis as a bet on efficient, founder led execution and a broad, cost effective platform, while flagging hardware dependence and security vulnerabilities as key risks.
Fair value in this bearish Narrative: about US$68.00 per share.
Implied premium vs last close around US$76.70: roughly 12.8%.
Revenue growth assumption: about 9.3%.
- Focuses on the risk that a hardware centric model, higher compliance costs, and strong competition in unified security could pressure growth and margins over time.
- Uses analyst assumptions for revenue, earnings, margins, and a future P/E of about 25.3x to anchor a fair value that sits below the current share price.
- Notes that stronger cybersecurity demand, AI driven security capabilities, and broader adoption across SMB and enterprise could challenge this cautious view.
Both Narratives use the same core data but reach very different conclusions. This is the real value for you as an investor, because it forces a choice about which set of assumptions, risks, and fair value feels closer to your own view of Fortinet.
Do you think there's more to the story for Fortinet? Head over to our Community to see what others are saying!

This article by Simply Wall St is general in nature. We provide commentary based on historical data and analyst forecasts only using an unbiased methodology and our articles are not intended to be financial advice. It does not constitute a recommendation to buy or sell any stock, and does not take account of your objectives, or your financial situation. We aim to bring you long-term focused analysis driven by fundamental data. Note that our analysis may not factor in the latest price-sensitive company announcements or qualitative material. Simply Wall St has no position in any stocks mentioned.
Have feedback on this article? Concerned about the content? Get in touch with us directly. Alternatively, email editorial-team@simplywallst.com