


- Wondering if Coterra Energy at around US$33.41 is offering real value or just tracking the wider market noise? This article breaks down what the current price might be telling you.
- The stock has seen a 3.3% decline over the last 7 days, a 3.9% gain over the last 30 days, and returns of 25.6% year to date and 37.3% over the past 12 months, which suggests sentiment around the shares has shifted over different time frames.
- Recent attention on Coterra Energy has centered on its role within the broader US energy sector and how investors weigh its exposure to commodity prices versus its cash generation profile. This backdrop helps explain why some market participants are reassessing both the upside potential and the risks at current levels.
- Coterra Energy currently has a valuation score of 5 out of 6. The next sections will break down what that means using several common valuation approaches, before finishing with a way to pull those methods together into a clearer view of value.
Find out why Coterra Energy's 37.3% return over the last year is lagging behind its peers.
Approach 1: Coterra Energy Discounted Cash Flow (DCF) Analysis
A Discounted Cash Flow, or DCF, model estimates what a business could be worth by projecting its future cash flows and discounting them back to today using a required return. It aims to answer what those future dollars are worth in present terms.
For Coterra Energy, the model used is a 2 Stage Free Cash Flow to Equity approach based on cash flow projections. The company’s latest twelve month Free Cash Flow is about $1.58b. Analyst and extrapolated projections point to Free Cash Flow of around $3.03b in 2030, with a series of estimates between 2026 and 2035 that Simply Wall St has discounted back to today to reflect time value and risk.
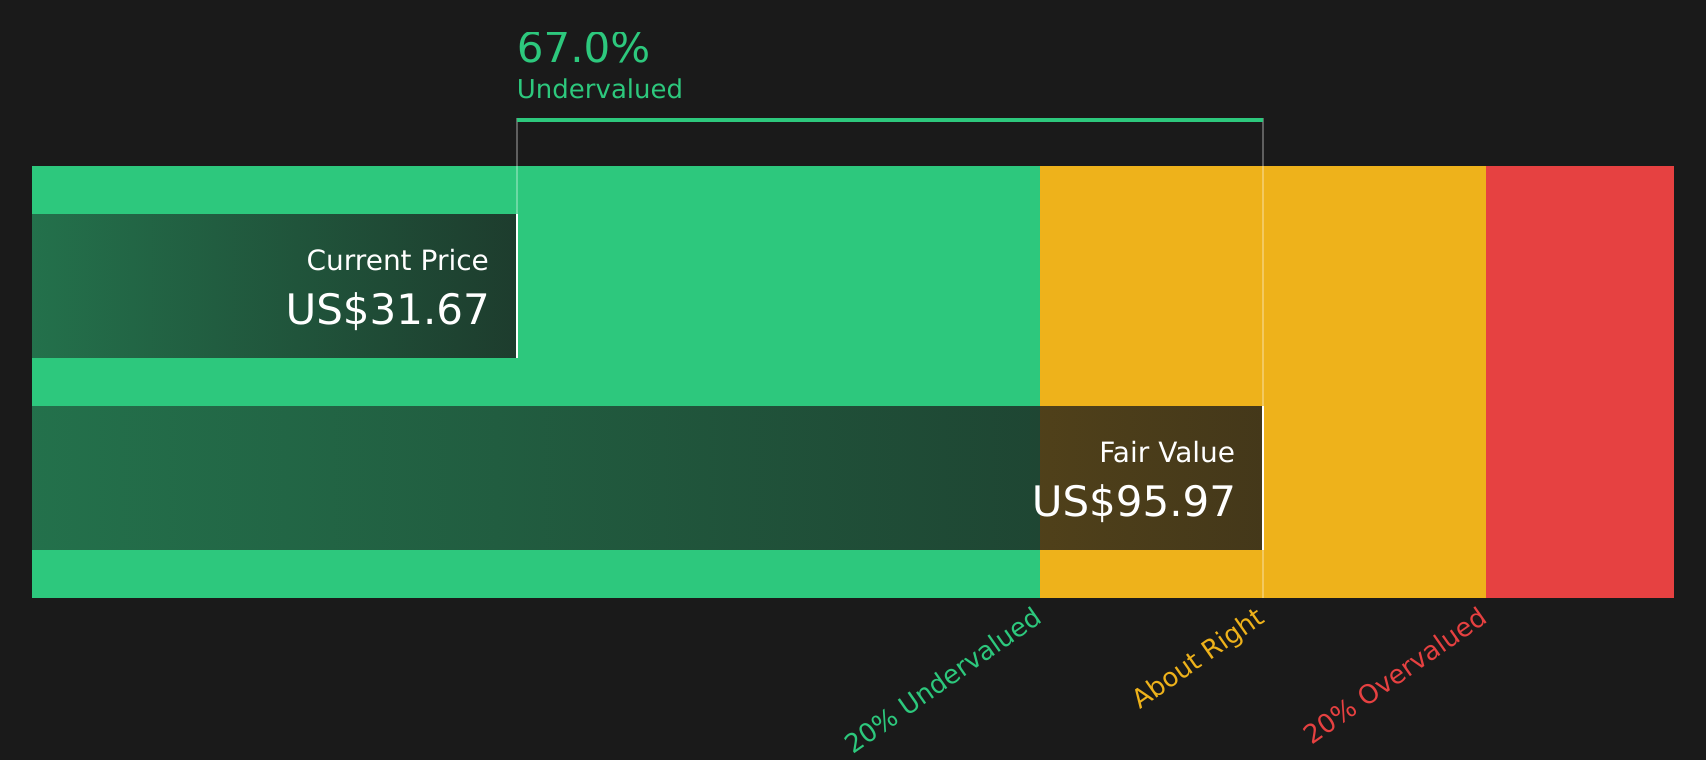
Bringing all of those projected cash flows together, the DCF model suggests an estimated intrinsic value of about $95.96 per share. Compared with the recent share price around $33.41, this indicates the stock is trading at roughly a 65.2% discount to the model’s calculated value, which indicates a wide valuation gap.
Result: UNDERVALUED
Our Discounted Cash Flow (DCF) analysis suggests Coterra Energy is undervalued by 65.2%. Track this in your watchlist or portfolio, or discover 58 more high quality undervalued stocks.
Approach 2: Coterra Energy Price vs Earnings
For a profitable company, the P/E ratio is a useful way to think about what you are paying for each dollar of earnings. It gives a quick sense of how the market is weighing the business today relative to its current profit, without getting lost in detailed projections.
What counts as a “normal” P/E depends on how the market views growth potential and risk. Higher expected growth or lower perceived risk can support a higher P/E, while lower growth expectations or higher risk usually point to a lower, more cautious multiple.
Coterra Energy currently trades on a P/E of about 14.8x. That sits close to the Oil and Gas industry average of about 15.1x and below the broader peer group average of around 25.3x. Simply Wall St’s Fair Ratio for Coterra Energy is 22.5x, which is its proprietary estimate of a suitable P/E given factors such as earnings growth profile, industry, profit margins, market cap and company specific risks.
Because the Fair Ratio blends these fundamentals, it can be more tailored than a simple industry or peer comparison that treats all companies as if they have the same prospects and risk profile. Set against the current 14.8x P/E, the 22.5x Fair Ratio points to the shares trading below that tailored benchmark.
Result: UNDERVALUED

P/E ratios tell one story, but what if the real opportunity lies elsewhere? Start investing in legacies, not executives. Discover our 18 top founder-led companies.
Upgrade Your Decision Making: Choose your Coterra Energy Narrative
Earlier it was mentioned that there is an even better way to understand valuation. Narratives bring your view of Coterra Energy’s story together with a simple forecast and a Fair Value that you can compare to today’s price to help decide whether the shares look attractive or stretched.
On Simply Wall St’s Community page, Narratives let you set assumptions for future revenue, earnings and margins, tie them to a clear explanation of what you think will drive Coterra Energy, and then translate that into a Fair Value that updates automatically when fresh news or earnings are released.
For example, one Coterra Energy Narrative on the bullish end might assume faster revenue growth, a 29.1% profit margin, earnings of US$2.7b by 2029 and a 14.3x future P/E. A more cautious Narrative might use 11.2% margins, US$1.0b of earnings and a 24.8x future P/E. Both give you a clear Fair Value that you can line up against the current share price to decide how closely the market matches your own story.
For Coterra Energy, however, we'll make it really easy for you with previews of two leading Coterra Energy Narratives:
Both are built from the same core data set but reach very different conclusions about what a fair value might look like. They give you a quick sense of the range of views currently in the market.
Fair value: US$37.36 per share
Implied valuation gap versus the recent US$33.41 share price: about 10.6% undervalued using this Narrative’s fair value.
Annual revenue growth assumption: 7.8%
- Focuses on expanding production across key US basins, lower per foot costs and a diversified oil and gas mix to support stable cash flow and lower earnings volatility.
- Builds in analyst assumptions for revenue growth, modest margin compression and share count reduction, then applies a 17.4x P/E on expected 2029 earnings to reach a fair value close to the current analyst consensus target.
- Flags risks around natural gas price weakness, operational issues in certain wells, regulatory and leasing uncertainty and the long term impact of Tier 1 inventory decline on costs and margins.
Fair value: US$25.55 per share
Implied valuation gap versus the recent US$33.41 share price: about 30.4% overvalued using this Narrative’s fair value.
Annual revenue growth assumption: 12.0%
- Places more weight on execution and external risks around LNG contracts, regulatory pressures and potential disruptions in global gas markets, despite supportive themes for LNG demand and power generation.
- Assumes that even with moderate revenue growth and better capital efficiency, the appropriate future P/E is 12.0x. This feeds into a lower fair value than today’s price.
- Highlights that long term earnings and valuation outcomes rely on consistent delivery from high return projects, stable policy settings and manageable competition from peers improving their own efficiency.
Taken together, these Narratives show how different assumptions about margins, LNG exposure, regulatory risk and the right P/E multiple can swing fair value for the same stock. If you want to see how other investors are framing the story and how their assumptions compare with your own, See what the community is saying about Coterra Energy.
Do you think there's more to the story for Coterra Energy? Head over to our Community to see what others are saying!

This article by Simply Wall St is general in nature. We provide commentary based on historical data and analyst forecasts only using an unbiased methodology and our articles are not intended to be financial advice. It does not constitute a recommendation to buy or sell any stock, and does not take account of your objectives, or your financial situation. We aim to bring you long-term focused analysis driven by fundamental data. Note that our analysis may not factor in the latest price-sensitive company announcements or qualitative material. Simply Wall St has no position in any stocks mentioned.
Have feedback on this article? Concerned about the content? Get in touch with us directly. Alternatively, email editorial-team@simplywallst.com