


Carvana: recent performance and what it might mean for investors
Carvana (CVNA) shares have moved sharply over recent months, with a 6.8% gain in the past day, 13.4% over the past week, and mixed returns over the month and past 3 months.
See our latest analysis for Carvana.
The recent rebound in Carvana’s share price, including a 19.7% 1 month share price return, comes after a 90 day share price return of 23.3%. The 1 year total shareholder return of 75.5% highlights how strong long term momentum has been.
If you are looking beyond Carvana for other ideas in the market, this could be a good moment to scan for opportunities in AI infrastructure names using our stock screener, starting with 37 AI infrastructure stocks.
With Carvana trading at US$359.27, an implied 15.8% intrinsic discount and an analyst target of US$423.50, you need to ask whether there is still a buying opportunity here or if the market is already pricing in future growth.
Most Popular Narrative: Fairly Valued
Carvana’s narrative assigns a fair value that sits in line with the current share price around $359.27, so the focus shifts from price gap to what underpins that view.
There are growing concerns among some market observers that Carvana's business model may be masking deeper financial instability. The company has a long history of operating with negative cash flow followed with rapid debit expansion , and unusually aggressive revenue recognition practices that raise questions about the sustainability of its margins. analysts have also noted that Carvana's reported improvements in profitability often coincide with accounting adjustments rather than genuine operational strength , suggesting the possibility of earnings "smoothing out". Additionally , the firms reliance on securitizing subprime auto loans creates opacity around the true quality of its assets; rising delinquencies in the used car loan market increase the risk that these securities are overvalued. when a company simultaneously carries heavy debt , thin cash reserves and complex financial structures that are difficult for outside investors to verify , it births skepticism.
If you want to understand how this narrative still lands near fair value, look at the implied margin path, revenue trajectory and future earnings multiple sitting in the background.
Result: Fair Value of $0 (ABOUT RIGHT)
Have a read of the narrative in full and understand what's behind the forecasts.
However, persistent concerns about cash flow quality and the potential for further regulatory or legal scrutiny could quickly challenge the current fair value narrative that investors are leaning on.
Find out about the key risks to this Carvana narrative.
Another View: Market Pricing Versus Earnings Multiple
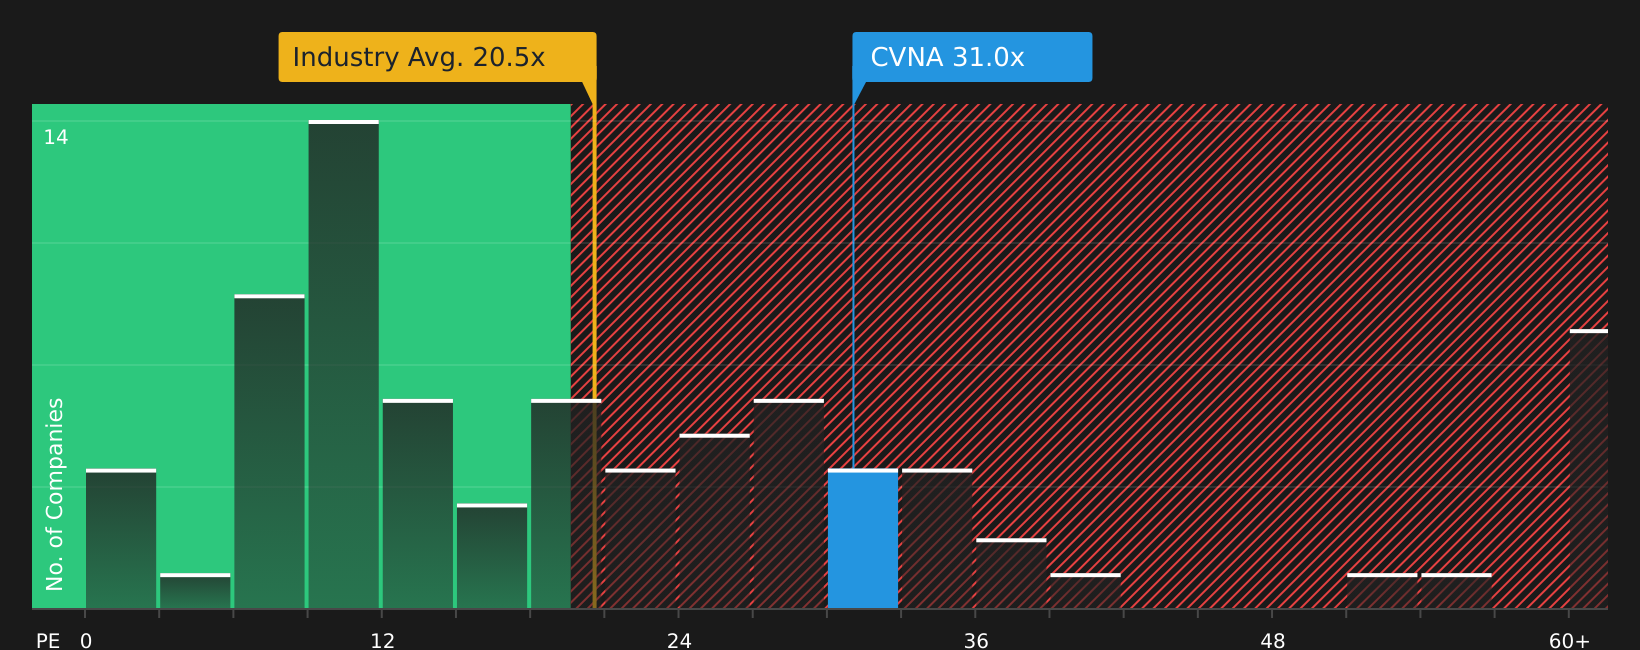
The earlier discussion pointed to Carvana trading about 15.8% below an estimated fair value. However, the current P/E ratio of 36.5x sits well above both the US Specialty Retail industry at 19.6x and peers at 18.4x, and even above a 29.5x fair ratio.
That gap suggests investors are paying a premium for Carvana’s growth story. The fair ratio also indicates the market could shift toward a lower multiple over time. The real question is whether the earnings profile justifies remaining on the higher side of that range or not.
See what the numbers say about this price — find out in our valuation breakdown.
Simply Wall St performs a discounted cash flow (DCF) on every stock in the world every day (check out Carvana for example). We show the entire calculation in full. You can track the result in your watchlist or portfolio and be alerted when this changes, or use our stock screener to discover 55 high quality undervalued stocks. If you save a screener we even alert you when new companies match - so you never miss a potential opportunity.
Next Steps
With sentiment this mixed, it helps to look past the headlines and review the underlying numbers yourself so you can decide quickly where you stand. To see what is getting investors optimistic, start with the 3 key rewards.
Looking for more investment ideas?
If Carvana has caught your attention, do not stop there. The broader market holds plenty of other opportunities worth putting on your radar right now.
- Target steadier growth potential by reviewing companies in the 73 resilient stocks with low risk scores that may suit a more measured approach to returns.
- Hunt for value by scanning the 55 high quality undervalued stocks and see which businesses currently trade at prices that might not reflect their fundamentals.
- Seek reliable income streams with the 10 dividend fortresses and focus on companies offering 5%+ yields with an emphasis on stability.
This article by Simply Wall St is general in nature. We provide commentary based on historical data and analyst forecasts only using an unbiased methodology and our articles are not intended to be financial advice. It does not constitute a recommendation to buy or sell any stock, and does not take account of your objectives, or your financial situation. We aim to bring you long-term focused analysis driven by fundamental data. Note that our analysis may not factor in the latest price-sensitive company announcements or qualitative material. Simply Wall St has no position in any stocks mentioned.
Have feedback on this article? Concerned about the content? Get in touch with us directly. Alternatively, email editorial-team@simplywallst.com