


Nelnet (NNI) is back on investors’ radar after recent trading pushed the share price to a last close of $133.21. This has prompted fresh attention on its mix of loan servicing, education technology, and banking activities.
See our latest analysis for Nelnet.
The recent move to $133.21 caps a mixed few months for Nelnet’s share price, with a modest 30 day share price return of 2.60% contrasting with a 90 day share price return of a 1.40% decline, while the 1 year total shareholder return of 27.88% and 5 year total shareholder return of 88.88% point to momentum that has been stronger over longer holding periods.
If you are weighing Nelnet’s mix of financial and technology led services, it can also be useful to broaden your watchlist with other high growth themes such as 37 AI infrastructure stocks
With Nelnet trading near its recent price target and with an intrinsic value estimate that sits above the current share price, the key question is whether there is still an opportunity for investors to consider or if the market has already fully reflected expectations in the current price.
Preferred P/E of 11.2x: Is it justified?
On a P/E of 11.2x at a last close of $133.21, Nelnet trades at a higher earnings multiple than both its Consumer Finance industry group and its closest peer set. This suggests the market is placing a premium on the company’s earnings profile.
The P/E ratio simply compares the current share price to earnings per share, so it reflects how much investors are paying for each dollar of earnings. For a business that combines loan servicing, education technology services, payments, asset management, and an online bank, the earnings stream spans several activities that tend to be sensitive to credit cycles and education related funding. This can influence how much of a premium or discount investors are willing to pay.
Here, the data points in different directions. On one hand, Nelnet’s earnings grew 132.8% over the past year, its net profit margin of 25.6% sits above last year’s 13.6%, and its earnings growth over the past year exceeded the broader Consumer Finance industry. On the other hand, earnings have declined by 15.6% per year over the past 5 years, return on equity is described as low at 11.1%, revenue is forecast to grow 3.3% per year which trails the wider US market, and debt is not well covered by operating cash flow. Taken together, the current P/E looks more like a premium that reflects recent profit strength rather than a clear signal of sustained growth or capital efficiency.
Against peers, the comparison is clear. Nelnet’s 11.2x P/E is described as expensive versus the US Consumer Finance industry average of 8.5x and also expensive relative to a peer average P/E of 9.7x. This means investors are paying more for Nelnet’s earnings than for similar companies in the same space.
See what the numbers say about this price — find out in our valuation breakdown.
Result: Price-to-Earnings of 11.2x (OVERVALUED).
However, there are still pressure points to keep in mind, including debt that is not well covered by operating cash flow and revenue growth of 3.3% that trails the wider US market.
Find out about the key risks to this Nelnet narrative.
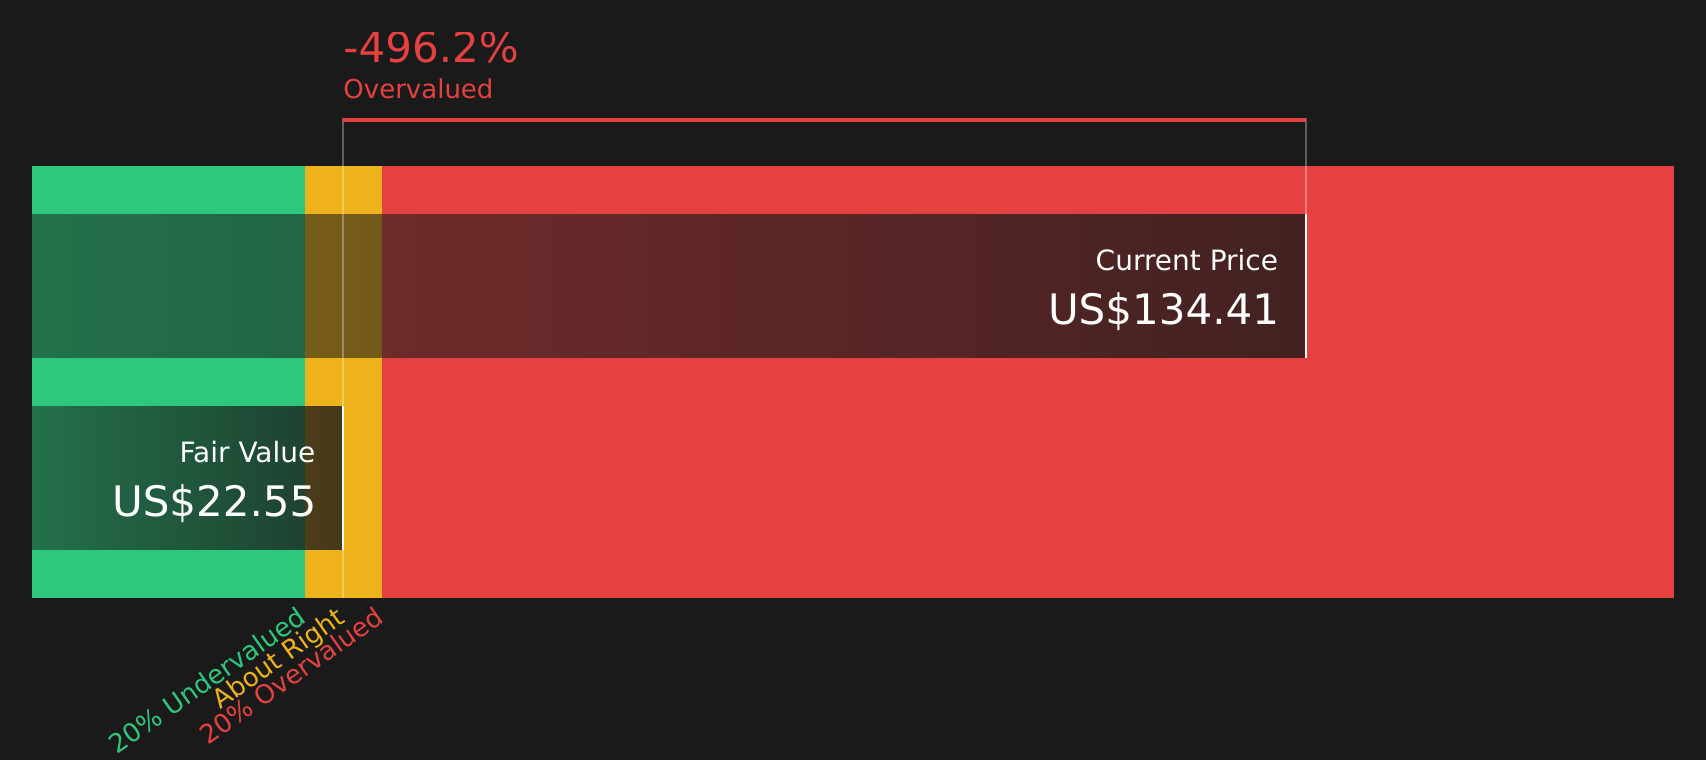
Another View: DCF Suggests A Very Different Price
While the 11.2x P/E makes Nelnet look expensive versus Consumer Finance peers, the SWS DCF model is even more conservative and puts future cash flow value at $23.24 per share versus the current $133.21. That gap points to valuation risk rather than upside. The key question is which signal you treat as more important.
Look into how the SWS DCF model arrives at its fair value.
Simply Wall St performs a discounted cash flow (DCF) on every stock in the world every day (check out Nelnet for example). We show the entire calculation in full. You can track the result in your watchlist or portfolio and be alerted when this changes, or use our stock screener to discover 55 high quality undervalued stocks. If you save a screener we even alert you when new companies match - so you never miss a potential opportunity.
Next Steps
With mixed signals across valuation methods and sentiment split between risks and rewards, it helps to look at the underlying data yourself and move quickly to form a clear view. To see that balance laid out in one place, review the 2 key rewards and 2 important warning signs
Looking for more investment ideas?
If Nelnet is on your radar, do not stop there. Use this moment to broaden your watchlist with focused shortlists that surface clear, data backed ideas quickly.
- Target value driven opportunities by checking stocks that combine quality fundamentals with attractive pricing through the 55 high quality undervalued stocks.
- Secure potential income streams by reviewing companies offering strong yields and resilient payouts in the 10 dividend fortresses.
- Prioritise resilience by scanning for companies with robust finances using the solid balance sheet and fundamentals stocks screener (41 results).
This article by Simply Wall St is general in nature. We provide commentary based on historical data and analyst forecasts only using an unbiased methodology and our articles are not intended to be financial advice. It does not constitute a recommendation to buy or sell any stock, and does not take account of your objectives, or your financial situation. We aim to bring you long-term focused analysis driven by fundamental data. Note that our analysis may not factor in the latest price-sensitive company announcements or qualitative material. Simply Wall St has no position in any stocks mentioned.
Have feedback on this article? Concerned about the content? Get in touch with us directly. Alternatively, email editorial-team@simplywallst.com