


First Busey (BUSE) is back on investors’ radar after first quarter 2026 results showed a shift from a loss to a profit, supported by higher net interest income and sharply lower net charge-offs.
See our latest analysis for First Busey.
The share price is now US$26.61, with a year to date share price return of 11.34% and a 1 year total shareholder return of 23.62%. This points to steady momentum that aligns with the profit rebound, reduced net charge offs and completion of the long running buyback.
If this shift in sentiment around First Busey has your attention, it may be a good time to broaden your search and look at 19 top founder-led companies
After a strong rebound in earnings and an 11.34% gain year to date, the stock now trades close to analyst targets yet still appears to have a high intrinsic discount. This raises the question of whether there is still a buying opportunity or if the market is already pricing in future growth.
Price-to-Earnings of 11.3x: Is it justified?
First Busey trades on a P/E of 11.3x, very close to both the US Banks industry average of 11.4x and its own estimated fair P/E of 11.3x. This suggests the current price broadly reflects peer expectations and the fair ratio model.
The P/E ratio compares the current share price to earnings per share, so for a bank like First Busey it gives a quick read on how the market values its current profit stream relative to other banks and its own earnings quality.
First Busey is flagged as good value on P/E when stacked against the industry and peer averages. However, the fair ratio model also tags it as expensive relative to its estimated fair P/E level, which hints that any shift in earnings expectations or sentiment could push that multiple closer to the fair ratio the model points to.
Compared with the US Banks industry P/E of 11.4x and a peer average of 13.6x, the stock sits at a slight discount to the sector and a larger discount to peers. At the same time, the fair P/E ratio of 11.3x suggests limited room for rerating unless earnings or perceptions around quality move, making the current multiple look finely balanced rather than obviously cheap or stretched.
Explore the SWS fair ratio for First Busey
Result: Price-to-Earnings of 11.3x (ABOUT RIGHT)
However, you still need to watch for weaker revenue or net income trends, as well as any shift in market sentiment that narrows the current intrinsic discount.
Find out about the key risks to this First Busey narrative.
Another way to look at value: DCF vs earnings multiple
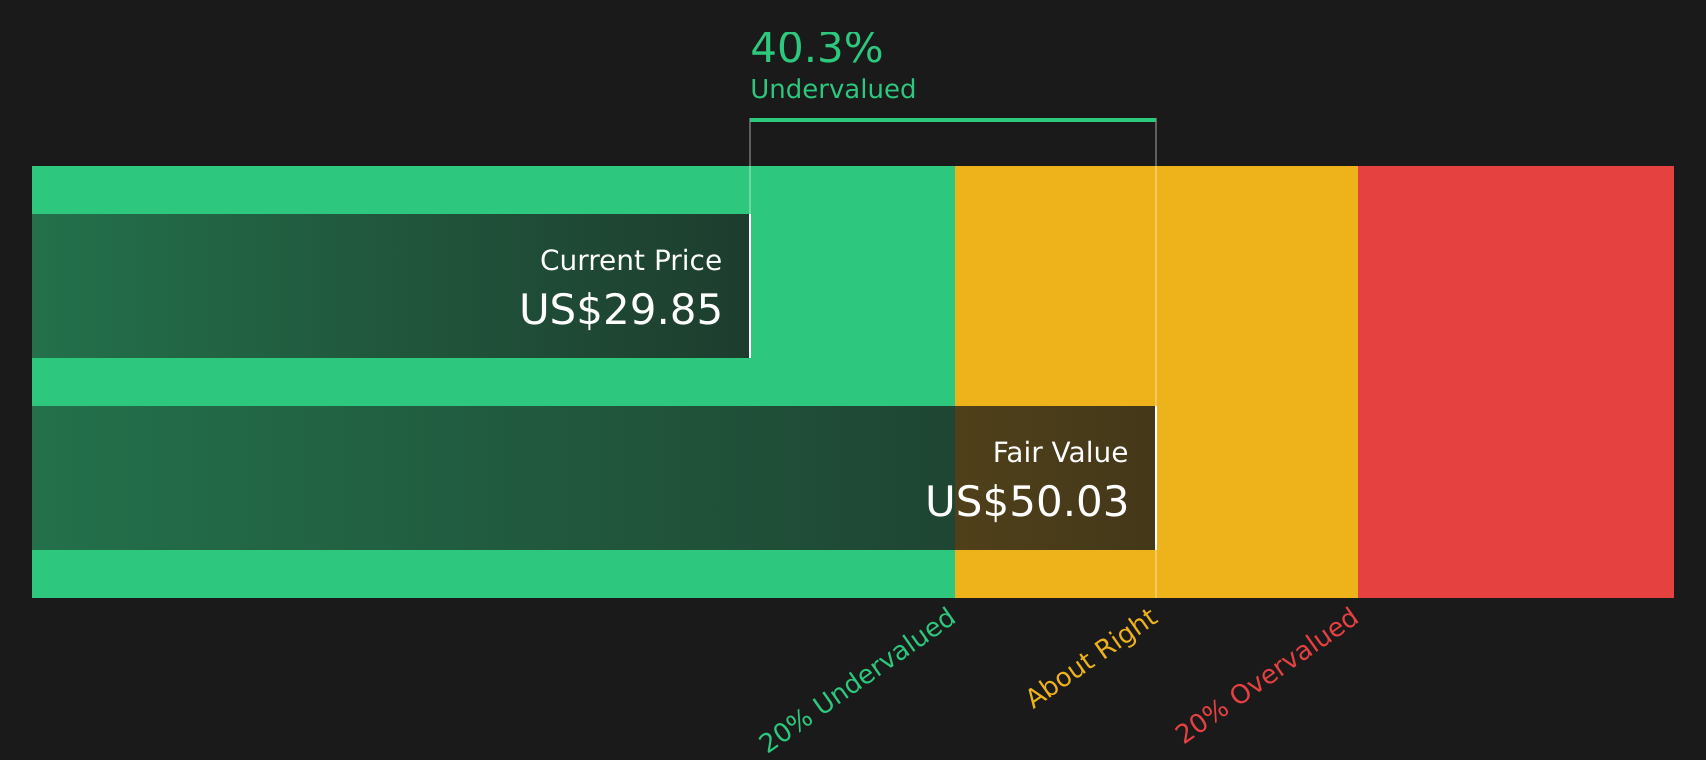
While the 11.3x P/E suggests First Busey is roughly in line with the US Banks industry, the SWS DCF model paints a very different picture. With the stock at $26.61 and an estimated future cash flow value of $50.07, the model implies the shares trade at a steep discount. Which signal do you trust more?
Look into how the SWS DCF model arrives at its fair value.
Simply Wall St performs a discounted cash flow (DCF) on every stock in the world every day (check out First Busey for example). We show the entire calculation in full. You can track the result in your watchlist or portfolio and be alerted when this changes, or use our stock screener to discover 49 high quality undervalued stocks. If you save a screener we even alert you when new companies match - so you never miss a potential opportunity.
Next Steps
If this mix of optimism and caution has you weighing the story, take a closer look at the underlying data and decide quickly where you stand by reviewing the 4 key rewards
Looking for more investment ideas?
If First Busey has sharpened your interest, do not stop here. Broaden your watchlist with other opportunities that could suit your goals and risk comfort.
- Target resilient companies that focus on capital strength and steady operations by checking out the solid balance sheet and fundamentals stocks screener (44 results).
- Spot potential bargains that combine quality and pricing support by scanning the 49 high quality undervalued stocks.
- Hunt for lesser known opportunities with solid fundamentals before the crowd catches on by reviewing the screener containing 21 high quality undiscovered gems.
This article by Simply Wall St is general in nature. We provide commentary based on historical data and analyst forecasts only using an unbiased methodology and our articles are not intended to be financial advice. It does not constitute a recommendation to buy or sell any stock, and does not take account of your objectives, or your financial situation. We aim to bring you long-term focused analysis driven by fundamental data. Note that our analysis may not factor in the latest price-sensitive company announcements or qualitative material. Simply Wall St has no position in any stocks mentioned.
Have feedback on this article? Concerned about the content? Get in touch with us directly. Alternatively, email editorial-team@simplywallst.com